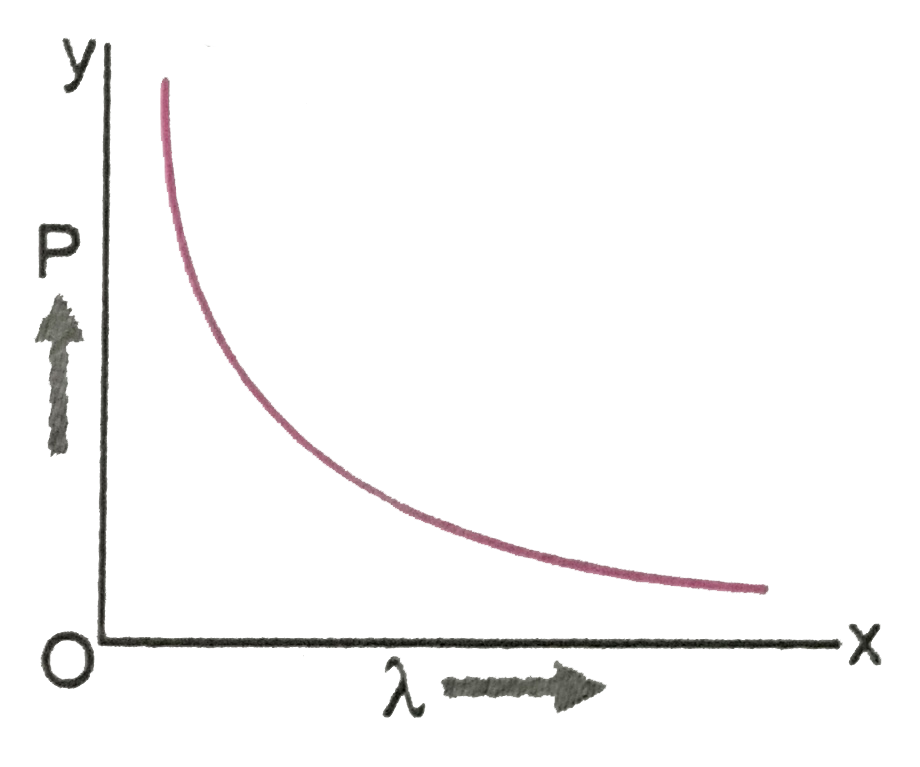
Draw a plot showing the variation of power of a lens with the wavelength of incident light.
Text Solution
Verified by Experts
From `P = (1)/(F) = (mu -1)((1)/(R_(1)) - (1)/(R_(2)))` As `lambda` increases, `mu` decreases. `:.` Power `P` decreases. The variation of `P` with `lambda` is as shown in Fig.
Topper's Solved these Questions
OPTICS
PRADEEP|Exercise Very short answer question|5 Videos
OPTICS
PRADEEP|Exercise very short answer questions|1 Videos
(a) Deduce the expression, by drawing a suitable ray diagram, for the refractive index of a triangular glass prisms in terms of the angle of minimum deviation (D) and the angle of prism (A). Draw a plot showing the variation of the angle of deviation with the angle of incidence. (b) Calculate the value of the angle of incidence when a ray of light incident on one face of an equilateral glass prism produces the emergent ray, which just grazes along the adjacent face. Refractive index of prism is sqrt2
Draw a plot showing the variation of photoelectric current versus the intensity of incident radiation on a given photosenstive surface.
Draw a plot showing the variation of de-Broglie wavelength of electron as a function of its K.E.
Define refractive index of a transparent medium. A ray of light passes through a triangular prism. Plot a graph showing the variation of the angle of deviation with the angle of incidence.
Define refractive index of a transparent medium. A ray of light passes through a triangular prism. Plot a graph showing the variation of angle of deviation with the angle of incidence. Hence derive prism formula.