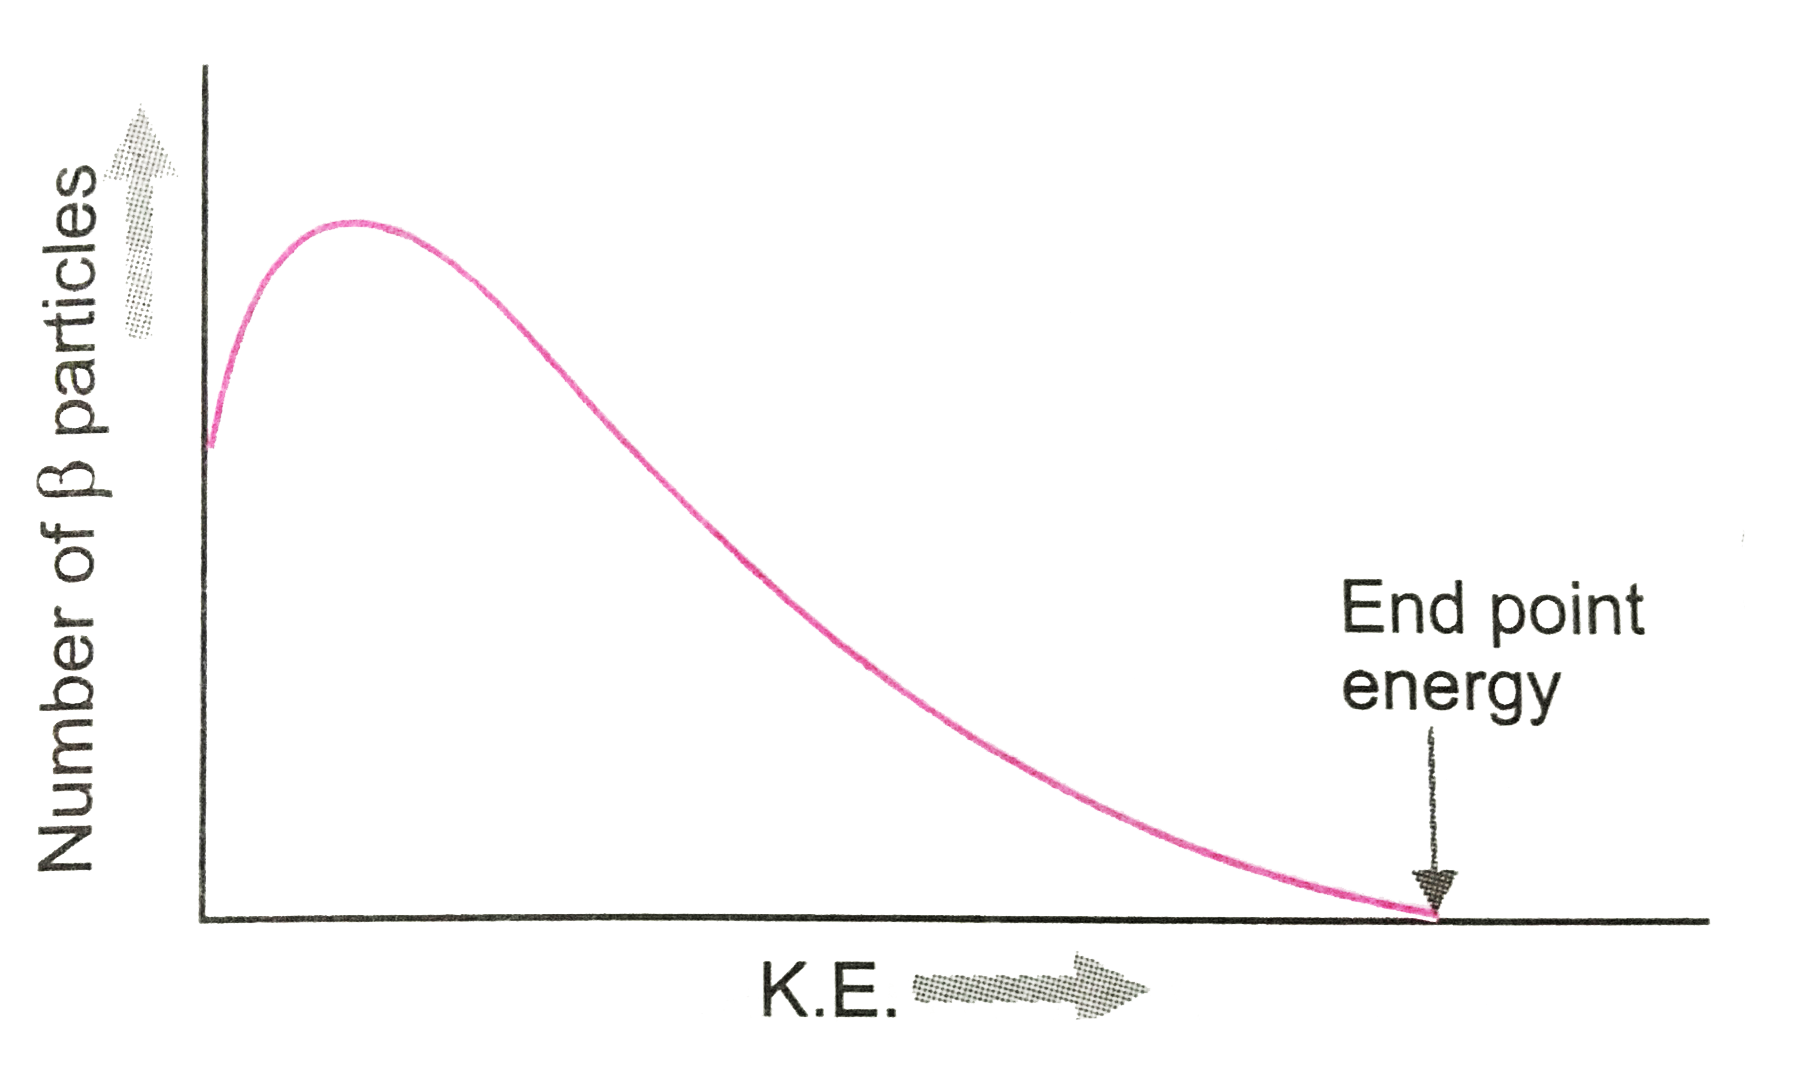
Draw the graph showing distribution of kinetic energy of electrons emitted during beta decay.
Text Solution
Verified by Experts
The distribution of K.E. of electrons emitted during beta decay is shown in fig.
Topper's Solved these Questions
ATOMS AND NUCLEI
PRADEEP|Exercise (II) very short answer 16|1 Videos
ATOMS AND NUCLEI
PRADEEP|Exercise (I) Short Answer questions 1|1 Videos
COMMUNICATION SYSTEMS
PRADEEP|Exercise MODEL TEST PAPER-2|9 Videos
Similar Questions
Explore conceptually related problems
During a beta decay
Kinetic energy of electrons emitted in photoelectric effect is
Draw a graph showing the variation of decay rate with number of active nuclei.
A nucleus ""_(10)Ne^(23) undergoes beta - decay and becomes ""_(11)Na^(23) . Calculate the maximum kinetic energy of electrons emitted assuming that the daughter nucleus and antineutrino carry negligible kinetic energy. Given mass of ""_(10)Ne^(23) = 22.994466 u and mass of ""_(11)Na^(23) = 22.989770 m
Draw a graph showing the intensity distribution of fringes due to diffraction at single slit
Draw the graph between displacement and kinetic energy for a particle executing SHM.
PRADEEP-ATOMS AND NUCLEI-Assertion- Reason type question 12