Home
Class 12
PHYSICS
(a) Draw a plot showing the variation of...

(a) Draw a plot showing the variation of potential energy of a pair of nucleons as a function of their separation . Mark the regions where the nuclear force is :
(i) attractive and (ii) repulsive.
(b) In the nuclear reaction
`n+underset(92)(235_(Uto))underset(54" ")(a_(Xe+))underset(b" ")(94_(Sr+2n))` determine the values of a and b .

Text Solution

Verified by Experts

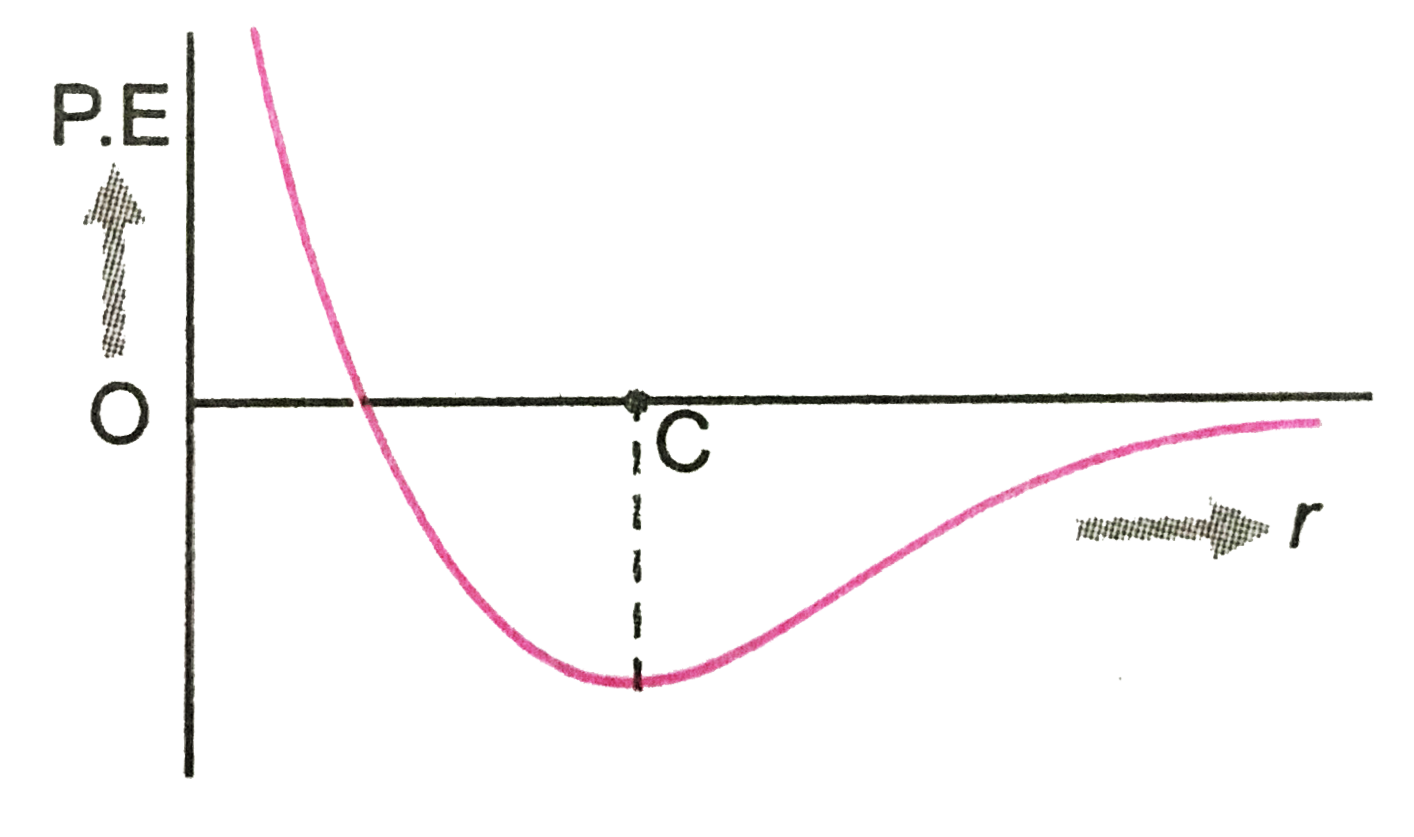
The variation of potential energy of a pair of nucleus as a function of their separation (r) is shown in fig.
We find that corresponding to r=OC=0.8fm, P.E. is minimum. At this distance, force between nucleons=0. for distance `gt OC`, negative P.E. goes on decreasing. The nuclear force are attractive. for distance `lt OC`, negative P.E. decreases, becomes zero and then increases. The nuclear forces in this region are repulsive.
Promotional Banner

Topper's Solved these Questions

  • ATOMS AND NUCLEI

    PRADEEP|Exercise Questions short 6|1 Videos
  • ATOMS AND NUCLEI

    PRADEEP|Exercise Questions short 7|1 Videos
  • ATOMS AND NUCLEI

    PRADEEP|Exercise (III) Questions short 28|1 Videos
  • COMMUNICATION SYSTEMS

    PRADEEP|Exercise MODEL TEST PAPER-2|9 Videos

Similar Questions

Explore conceptually related problems

Draw a plot of potential energy of a pair of nucleons as a function of their separation . Write two important conclusions which you can draw regarding the nature of nuclear forces .

The following nuclear reaction is an example of underset( 6) overset(12)(. ) C + underset(2) overset(4) (. ) H to underset( 8) overset( 16) (. ) O + energy

Nuclear energy is released in fusion reaction, since binding energy per nucleon is