Text Solution
Verified by Experts


Similar Questions
Explore conceptually related problems
Recommended Questions
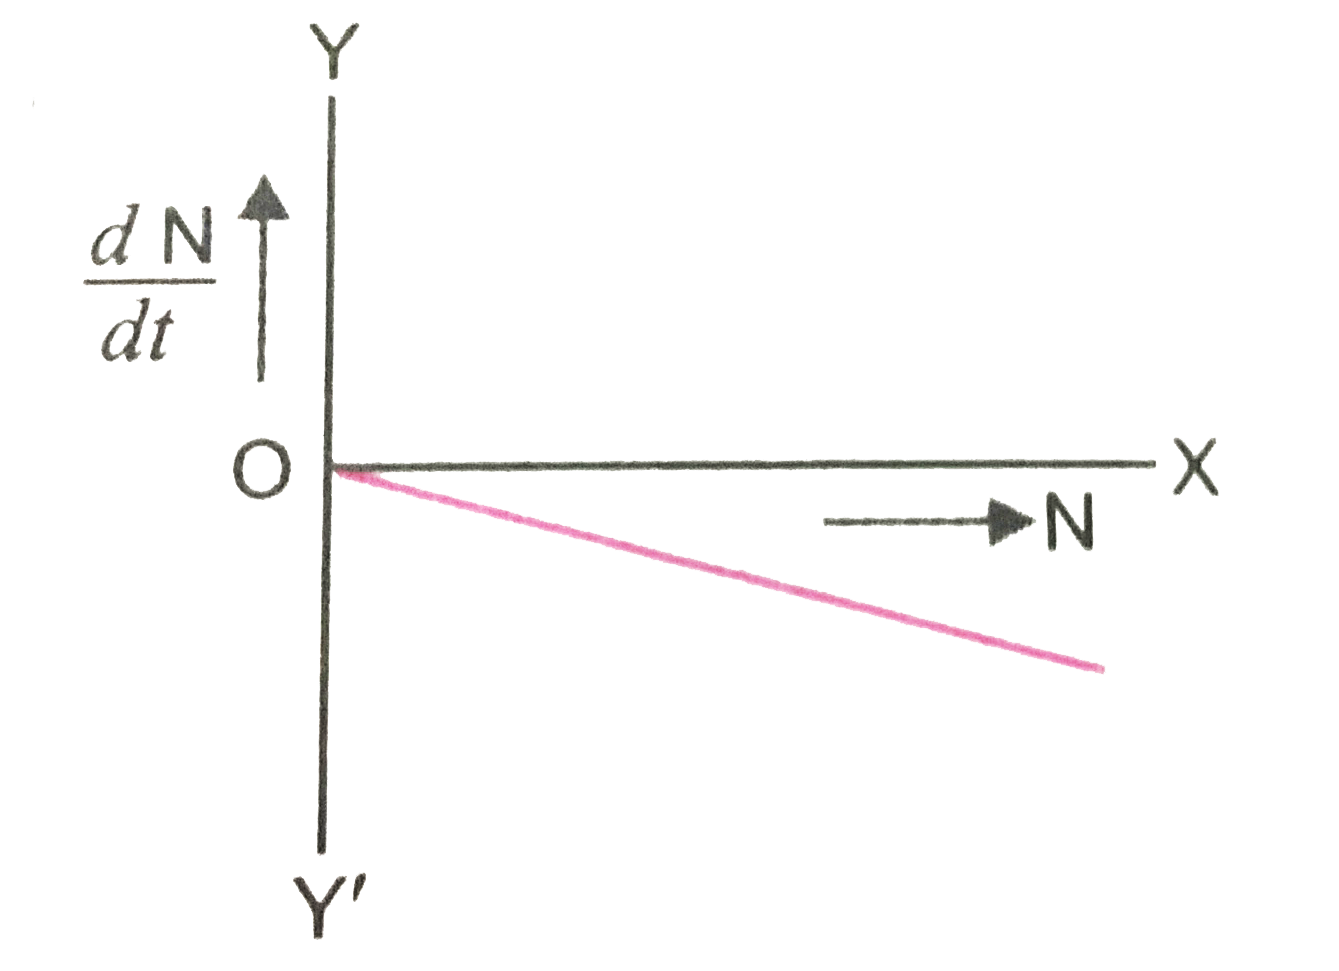
- Draw a graph showing the variation of decay rate with number of active...
Text Solution
|
- Draw a graph showing the variation of decay rate with number of active...
Text Solution
|
- A radioactive isotope X decays into a stable nucleus Y. Draw graphs sh...
Text Solution
|
- Draw a graph showing the variation of decay rate with number of active...
Text Solution
|
- Draw the graph showing variation of resistivity with temperautre for s...
Text Solution
|
- रेडियोऐक्टिव क्षय को प्रदर्शित करने वाला ग्राफ खीचिए। रेडियोऐक्टिव ना...
Text Solution
|
- दर्शाइए कि एक रेडियोऐक्टिव नाभिक के नमूने की क्षय दर R उसी क्षय पर रेड...
Text Solution
|
- Show that the decay rate R of a sample of ratio nuclide at some instan...
Text Solution
|
- The graph showing the variation of decay rate with number of nuclei is...
Text Solution
|