Text Solution
Verified by Experts


Similar Questions
Explore conceptually related problems
Recommended Questions
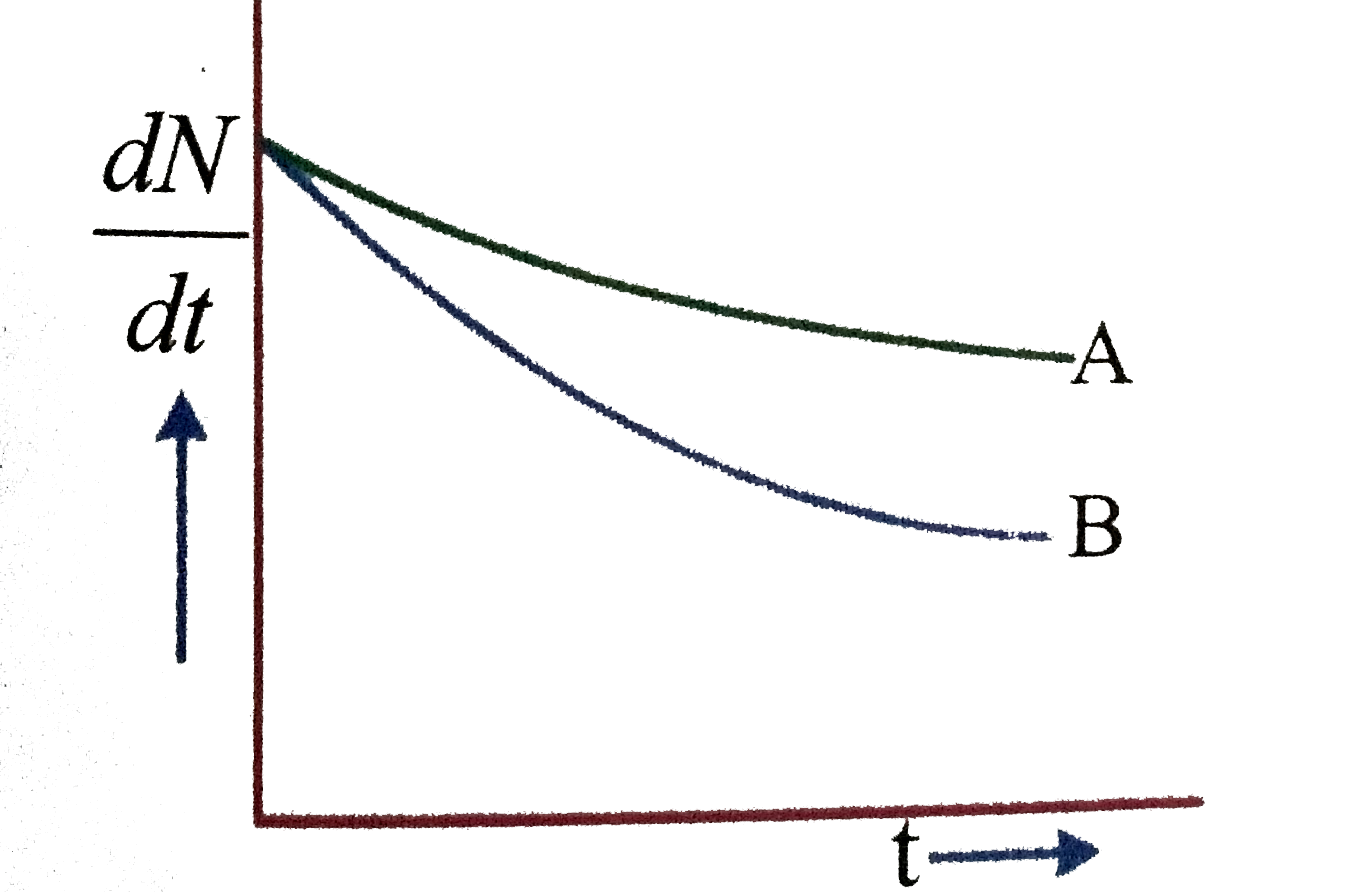
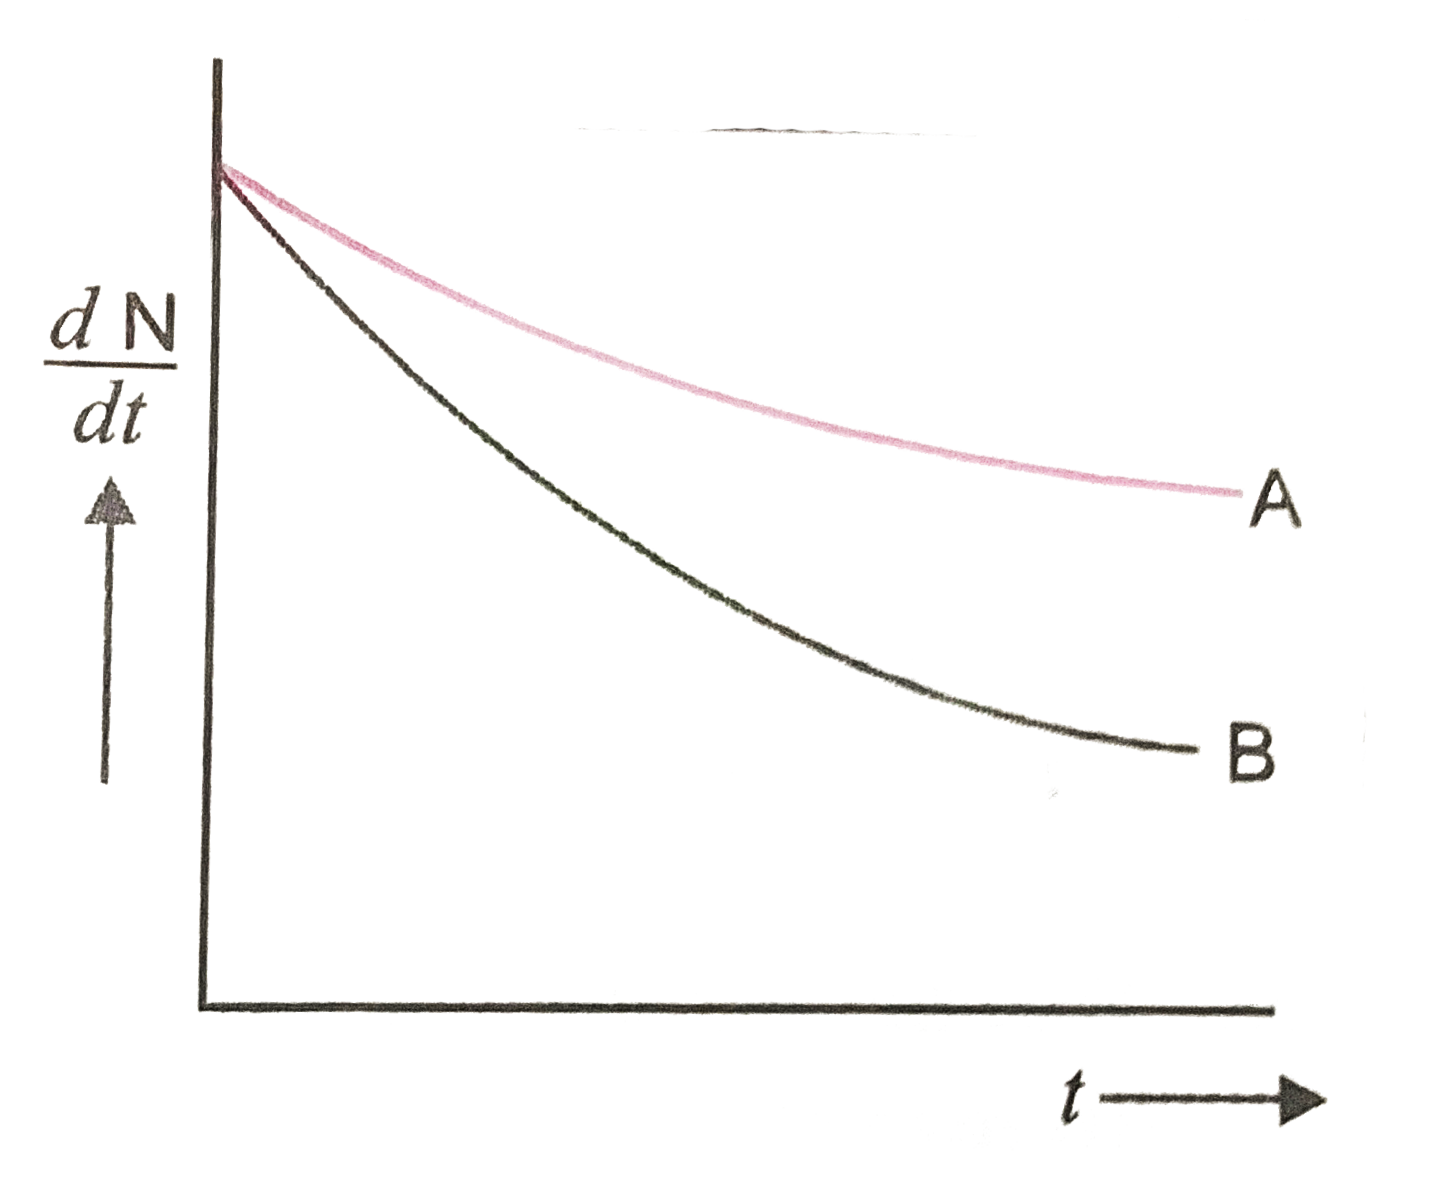
- Which sample A or B shown in figure has shorter mean-life ?
Text Solution
|
- In a mean life of a radioactive sample
Text Solution
|
- Which sample A or B shown in figure has shorter mean-life ?
Text Solution
|
- Which sample A or B shown in figure has shorter mean-life ?
Text Solution
|
- If the half-life of a radioactive sample is 10 hours its mean life is
Text Solution
|
- A radioactive sample has ,a half life of 10 days. What is its disinteg...
Text Solution
|
- Which one of the following nuclei has shorter mean life?
Text Solution
|
- Which sample, A or B, shown in the following figure has shorter mean l...
Text Solution
|
- The half-life of a radioactive sample A is same as the mean life of sa...
Text Solution
|