 .
.


Similar Questions
Explore conceptually related problems
Recommended Questions
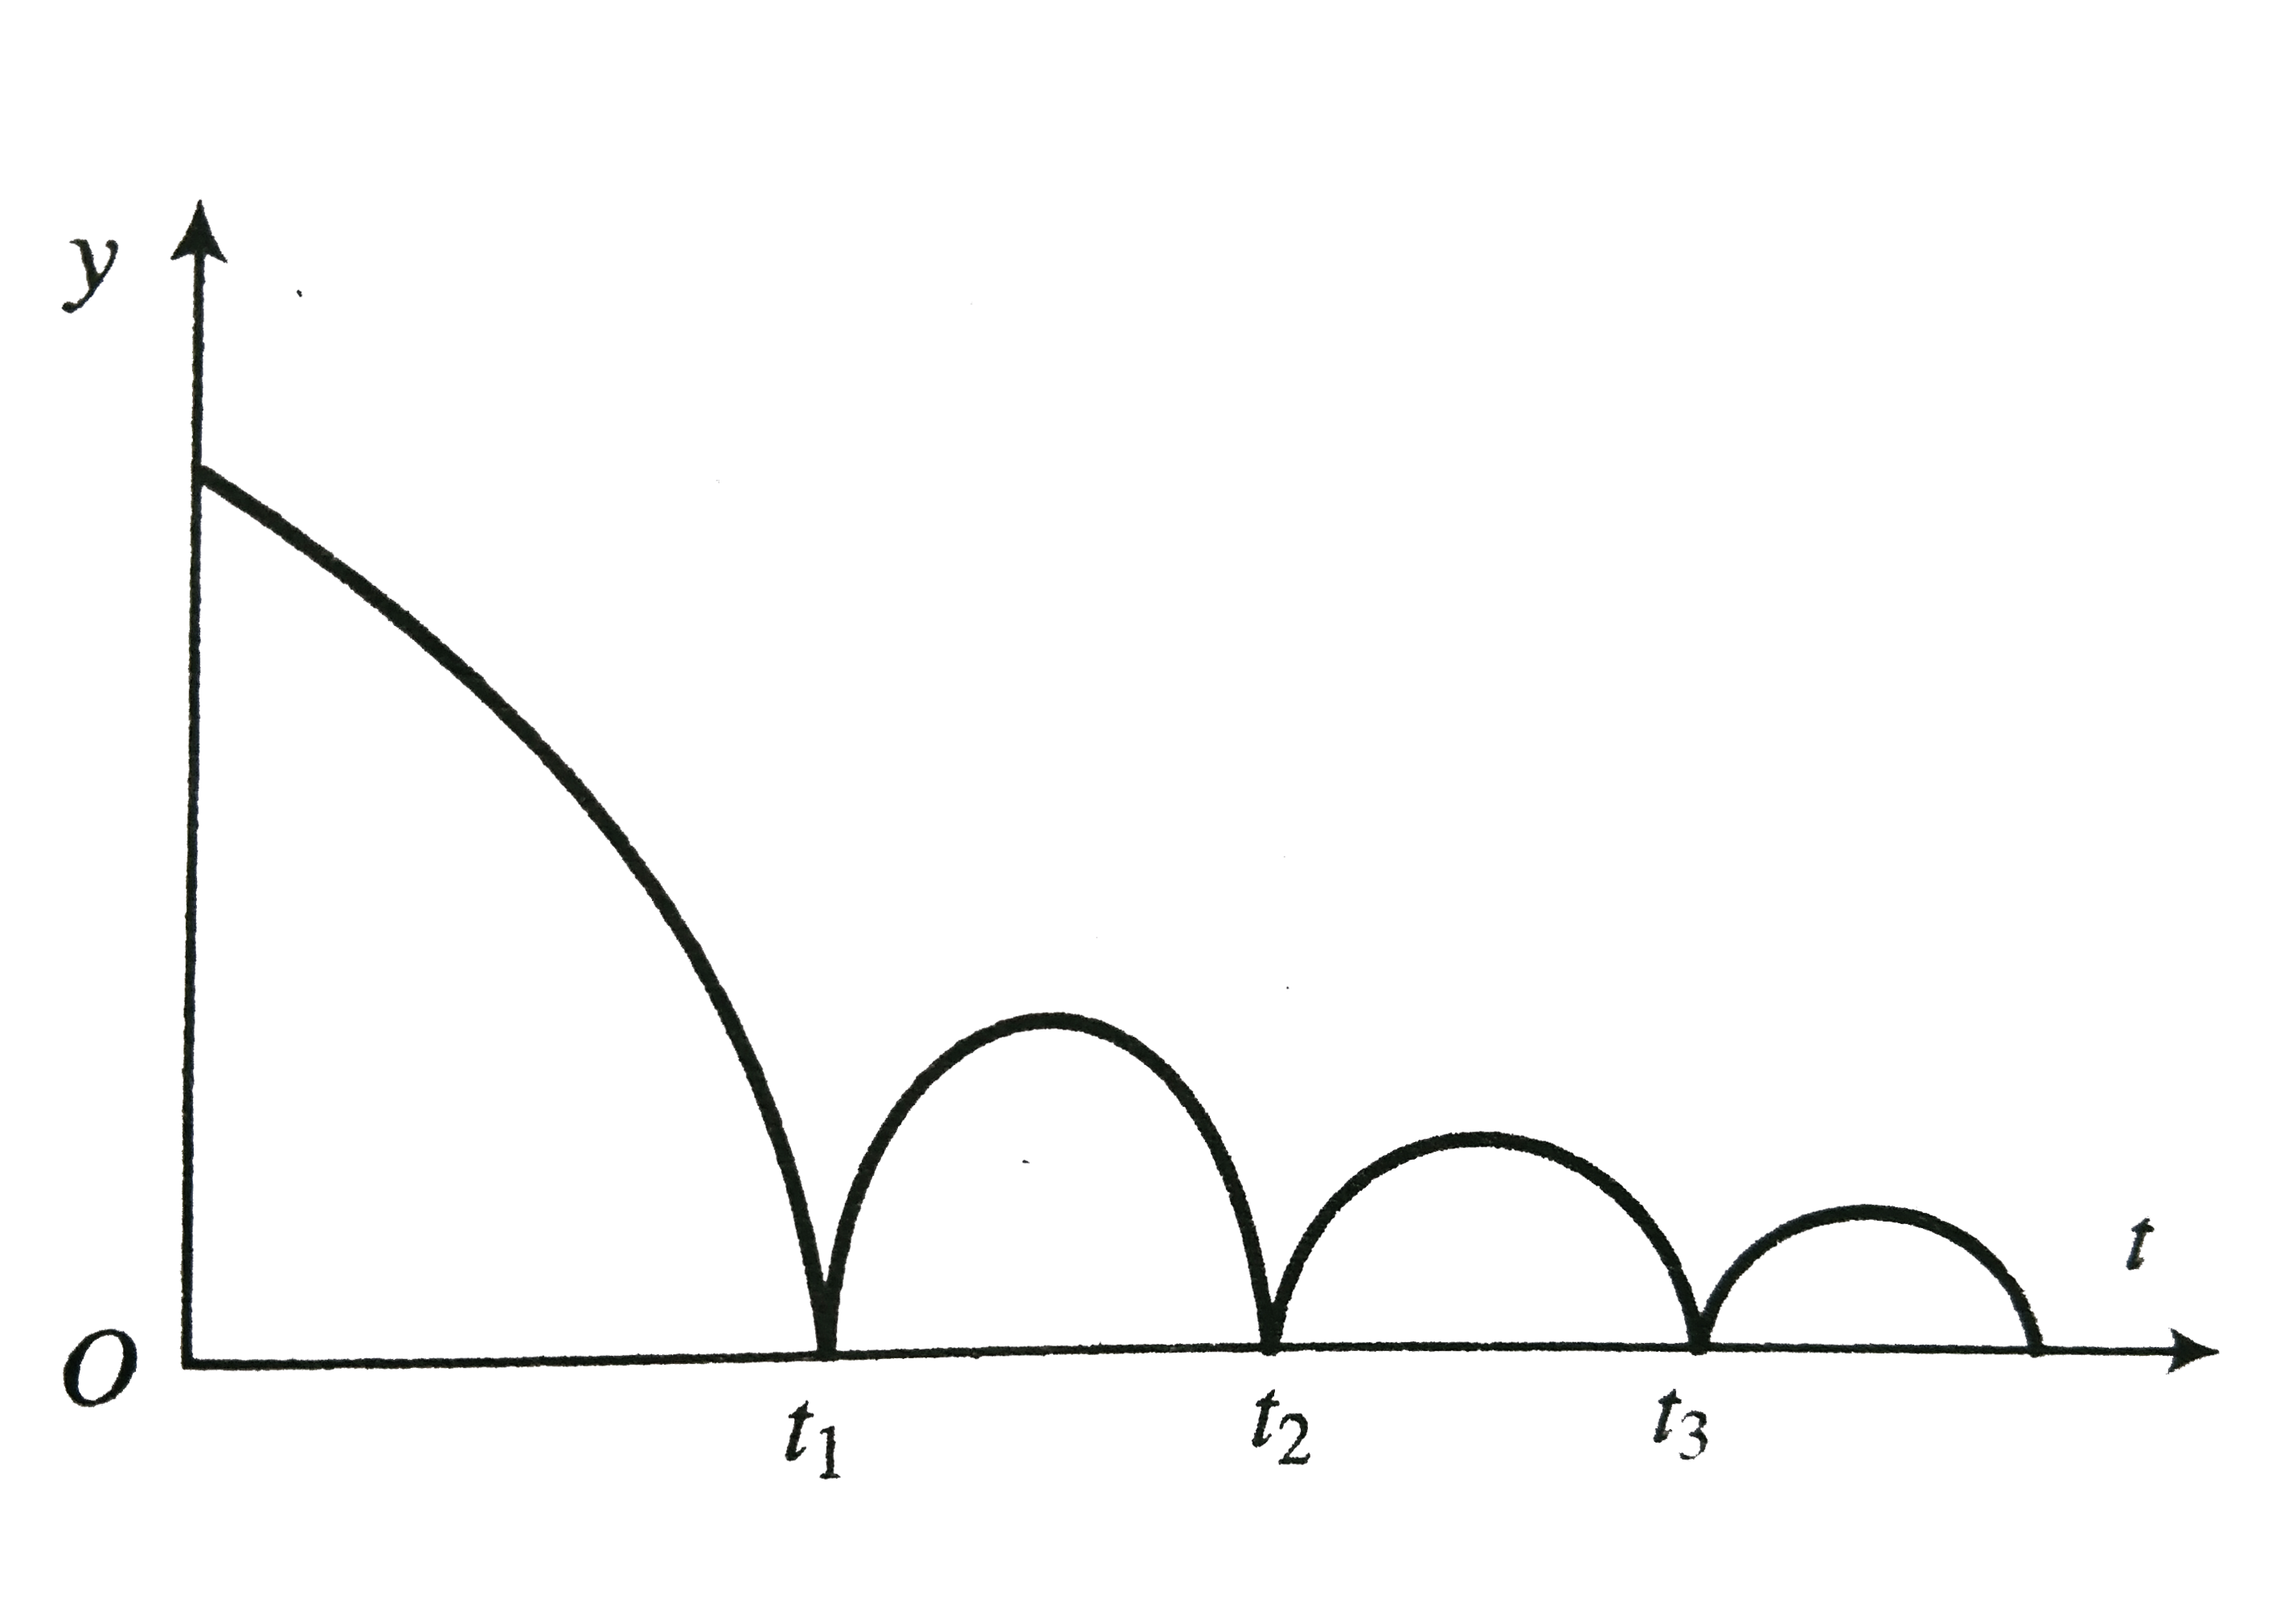
- The graph as shown in. below descrines the motion of a ball rebounding...
Text Solution
|
- The graph as shown in. below descrines the motion of a ball rebounding...
Text Solution
|
- A ball strikes a smooth horizontal floor obliquely and rebounds inelas...
Text Solution
|
- A ball is projected upwards from a height h above the surface of the e...
Text Solution
|
- A ball of mass 2kg dropped from a height H above a horizontal surface ...
Text Solution
|
- A ball is released from point A. During its motion ball takes two seco...
Text Solution
|
- .A ball is projected upwards from a height h above the surface of the...
Text Solution
|
- A ball is dropped from an elevator moving upward with acceleration 'a'...
Text Solution
|
- 100 g mass and 4.9 xx 10^(-5) C A charged ball is released from a stat...
Text Solution
|