


Similar Questions
Explore conceptually related problems
Recommended Questions
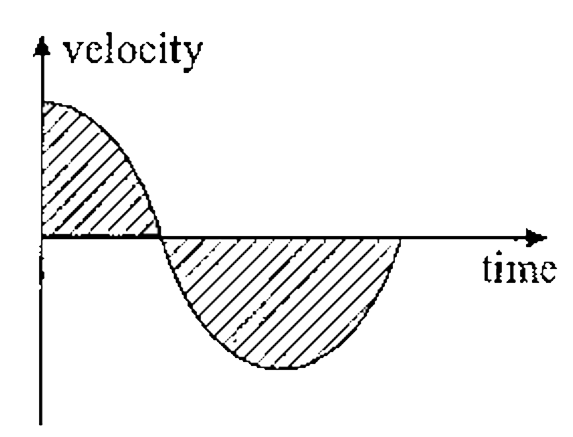
- The diagram shows the velocity-time graph for a particle moving in a s...
Text Solution
|
- The acceleration versus time graph of a particle moving in a straight ...
Text Solution
|
- The figure shows a velocity-time graph of a particle moving along a st...
Text Solution
|
- The figure shows a velocity-time graph of a particle moving along a st...
Text Solution
|
- The force acting on a particle moving along a straight line varies wit...
Text Solution
|
- The diagram shows the velocity-time graph for a particle moving in a s...
Text Solution
|
- Figure below shows the velocity-time graph of a one dimensional motion...
Text Solution
|
- The figure shows a velocity-time graph of a particle moving along a st...
Text Solution
|
- The figure shows a velocity-time graph of a particle moving along a st...
Text Solution
|