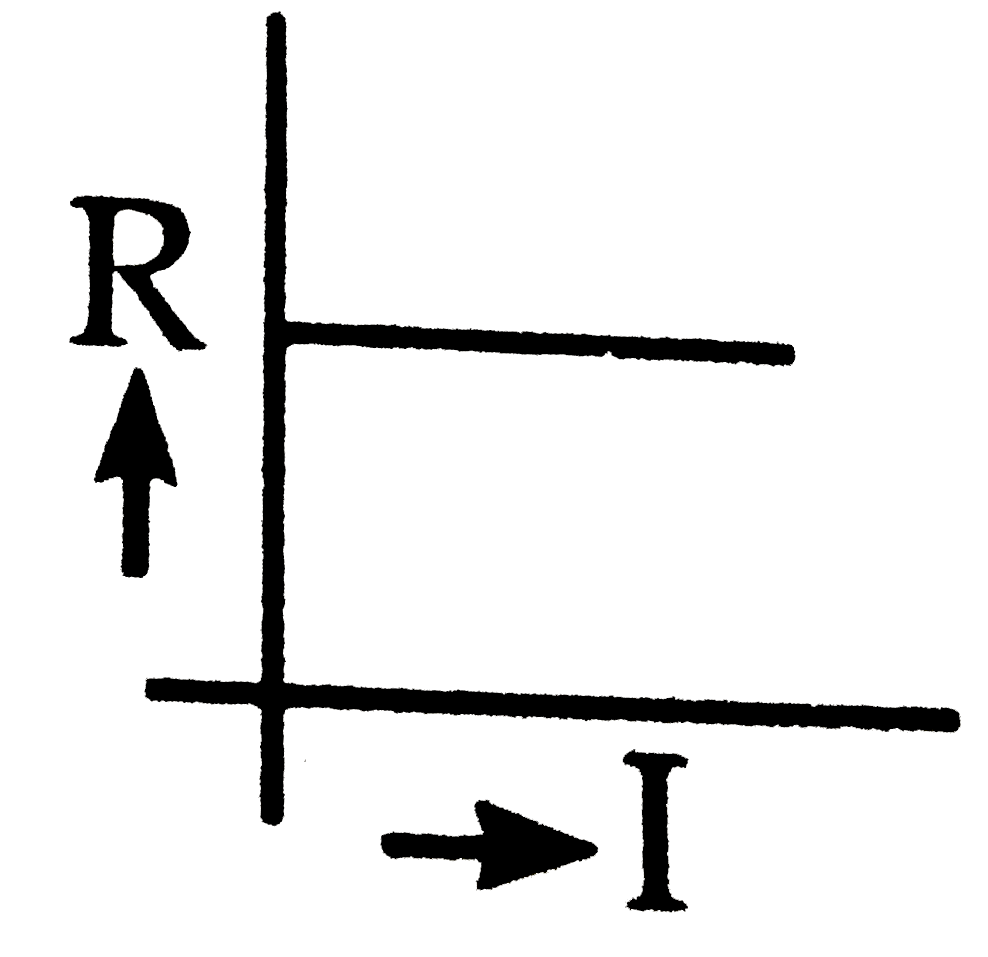
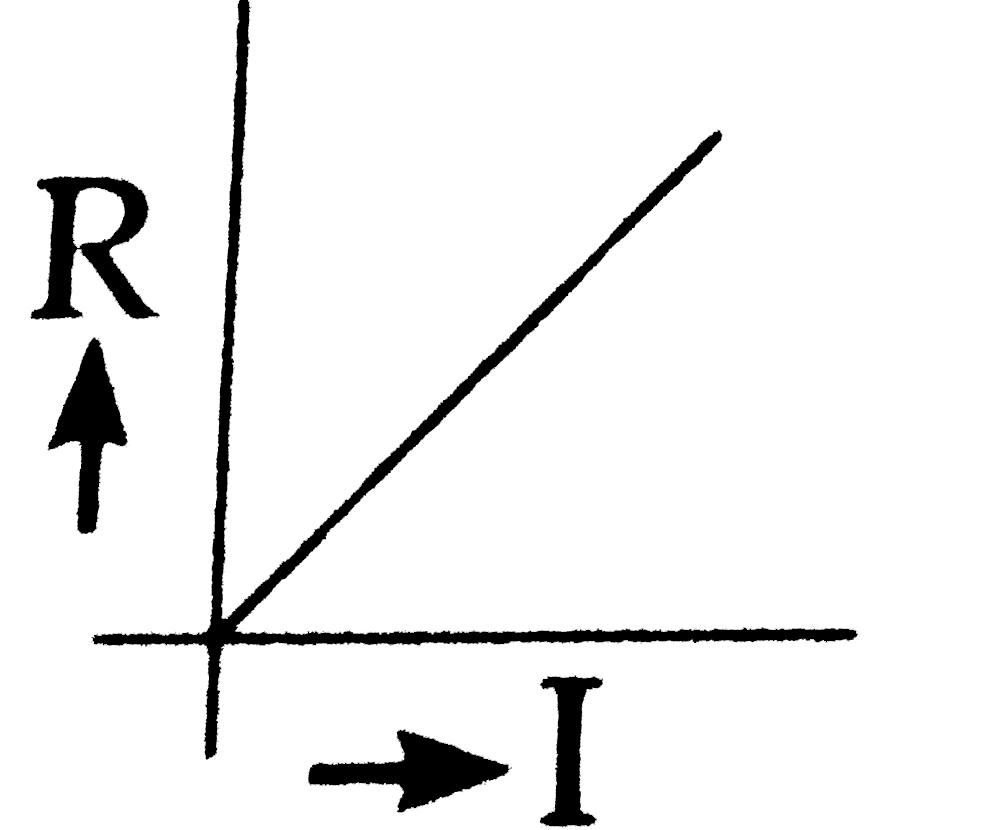
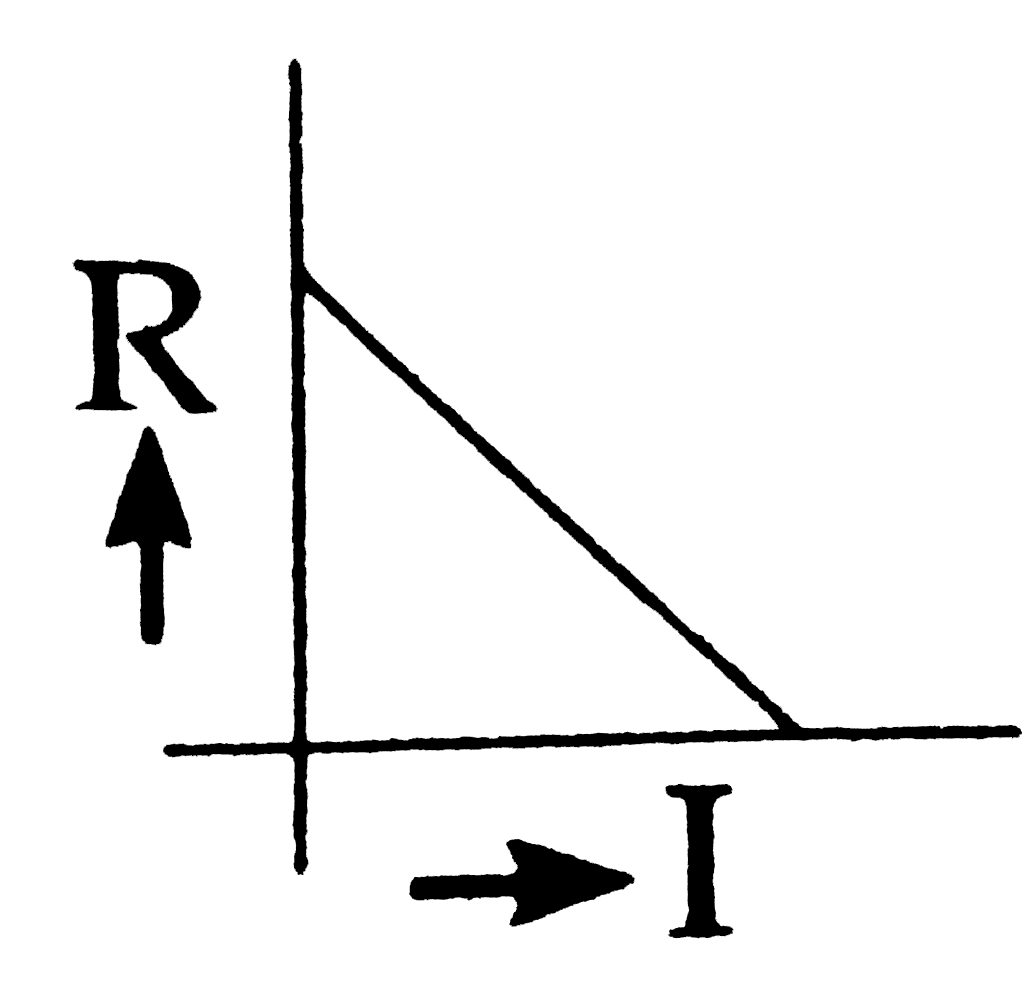
Of the following graphs , the one which shows the relationship between the resistance R of multirange moving coil ammeter and its range I is
A
B
C
D
Text Solution
Verified by Experts
The correct Answer is:
C
Topper's Solved these Questions
MAGNETIC EFFECT OF ELECTRIC CURRENT
NIKITA PUBLICATION|Exercise MCQs (Sensitivity and accuracy of M.C.G.)|1 Videos
KINETIC THEORY OF GASES & RADIATION
NIKITA PUBLICATION|Exercise MCQs (Question Given in MHT-CET)|79 Videos
MAGNETISM
NIKITA PUBLICATION|Exercise MCQs|249 Videos
Similar Questions
Explore conceptually related problems
The graph which represents the relation between the total resistance R of a multi range moving coil voltmeter and its full scale deflection
Which of the following graphs shows the relationship between the rate of an enzymatic activity and substrate concentration (S) ?
A circular coil of single turn has a resistance of 20 Omega Which one of the following is the correct value for the resistance between the ends of any diameter of the coil?
Which one of the following graphs in figure shows the variation of photoelectric current (I) with voltage (V) between the electrodes in a photoelectric cell?
The figure shows a relationship between the sets P and Q. Write this relation : (i) in set-builder from (ii) Roaster from. What is its domain and range?
The Figure shows a relationship between the sets P and Q. Write this relation ( i in set- builder form (ii) roster form.What is its domain and range?
The resistance of a galvanometer coil is R . What is the shunt resistance required to convert it into an ammeter of range 4 times
NIKITA PUBLICATION-MAGNETIC EFFECT OF ELECTRIC CURRENT-MCQs (Sensitivity and accuracy of M.C.G.)