Home
Class 10
MATHS
The frequency distribution of the marks ...

The frequency distribution of the marks obtained by 76 students in a math. Find the average of marks obtained .
`{:("Numbers obtained",1-10,11-20,21-30,31-40,41-50,"Total"),("Frequncies",4,14,32,18,8,76):}`

Text Solution

Verified by Experts


`therefore u=(12)/(76)=0.158`
`therefore barx=25.5+10xx0.158=25.5 +1.58=27.08` (approx.)
Promotional Banner

Topper's Solved these Questions

  • MEASURES OF CENTRAL TENDENCY

    CALCUTTA BOOK HOUSE|Exercise EXERCISE|36 Videos
  • CONSTRUCTION: CONSTRUCTION OF TANGENT TO A CIRCLE

    CALCUTTA BOOK HOUSE|Exercise Exercise-8.2|5 Videos
  • MEDIAN AND MODE

    CALCUTTA BOOK HOUSE|Exercise EXERCISE|20 Videos

Similar Questions

Explore conceptually related problems

The frequency distribution of marks in Mathematics obtained by 50 students in an examination is given below. Find mode.

The marks obtained by 41 students in an examination in Math are given below: Find the average of the marks obtained by them.

The marks obtained by 30 students in a examination of a class are given below . Find their average.

Find the median and mode of the marks obtained by 30 students given in the question number 11 in exercise-1.

The mean deviation about the median of the following distribution is {:("Marks obtained",10,11,12,14,15),("Number of students",2,3,8,3,4):}

What is the standard deviation of the following data ? {:("Measurement",0-10,10-20,20-30,30-40),("Frequency",1,3,4,2):} (a) 81 (b) 7.6 (c) 9 (d) 2.26

The arithmetic means of the marks obtained by the students of a school in English and Bengali are 40.25 and 48.50 respectively . Find the averages of the sums of the marks obtained in English and Bengali.

Find the mode of the following frequency distribution of obtained marks of 22 students.

The mean and standard deviation of marks obtained by 50 students of a class in three subjects, Mathematics, Physics and Chemistry are given below: {:("Subject","Mathematics","Physics","Chemistry"),("Mean",42,32,40.9),("Standard deviation",12,15,20):} Which of the three subjects shows the highest variability in marks and which shows the lowest?

Following are the marks obtained by 9 student in a mathematics test 50,69,20,33,53,39,40,65,59, The mean deviation from the median is

CALCUTTA BOOK HOUSE-MEASURES OF CENTRAL TENDENCY-EXERCISE
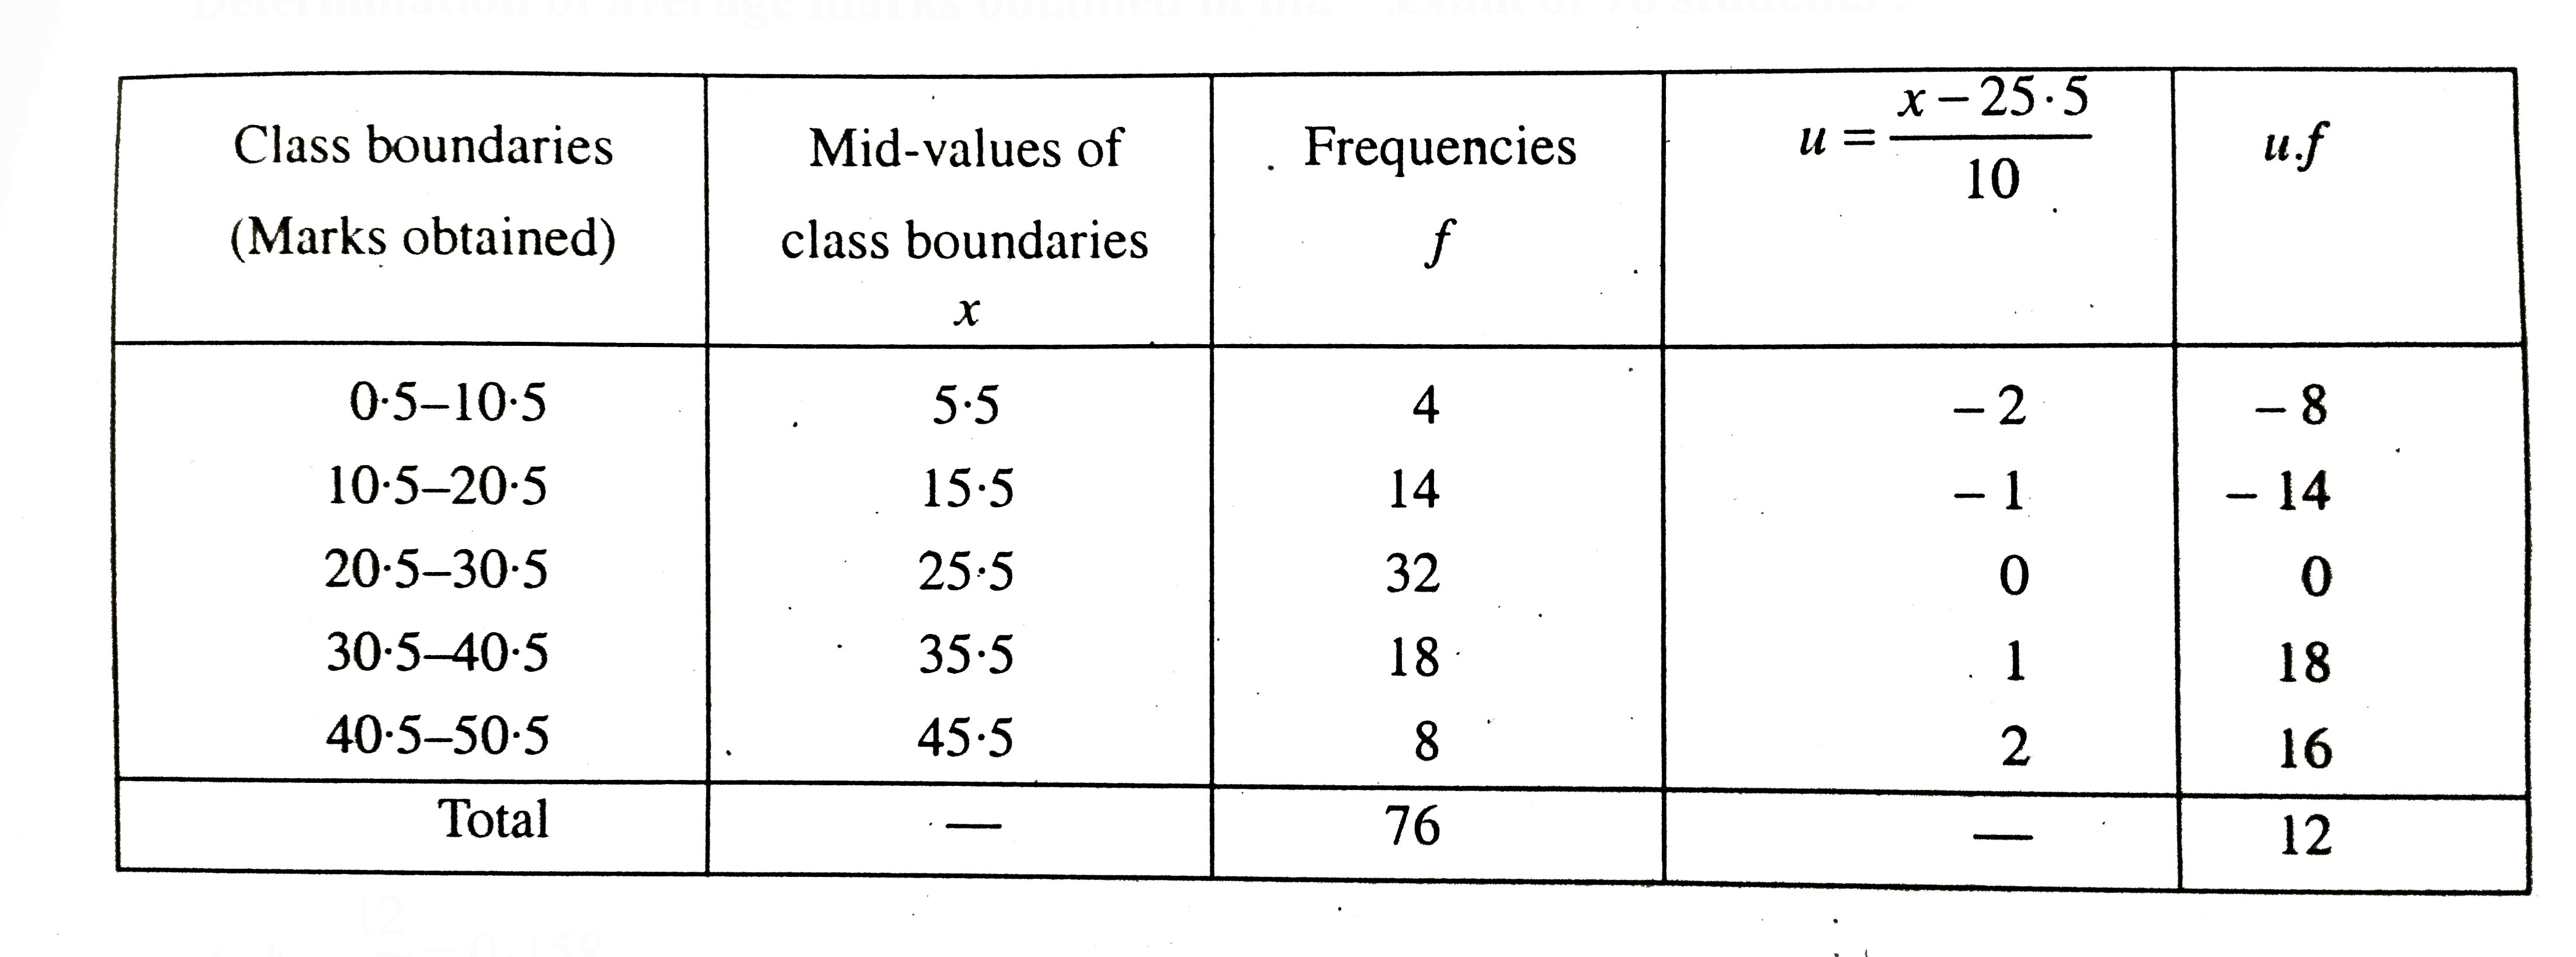
  1. The frequency distribution of the marks obtained by 76 students in a m...

    Text Solution

    |

  2. How arithmetic mean is changed when the values of the variable are add...

    Text Solution

    |

  3. How AM, GM and HM of the values of a variable are changed when the val...

    Text Solution

    |

  4. Find the average of first n-natural numbers.

    Text Solution

    |

  5. What is the algebraic sum of the deviations of the values of a variabl...

    Text Solution

    |

  6. If two positive values of a variable be x(1) and x(2) and the arithmet...

    Text Solution

    |

  7. Find the average of the variable. The incomes of three friends are ...

    Text Solution

    |

  8. Find the average of the variable. The diameters of five pipes are :...

    Text Solution

    |

  9. Find the average of the variable. The selling prices of seven days ...

    Text Solution

    |

  10. In the following table the prices of salt per quintal of secen days of...

    Text Solution

    |

  11. The marks obtained by 30 students in a examination of a class are give...

    Text Solution

    |

  12. The frequency distribution of the family members of 65 families are gi...

    Text Solution

    |

  13. The weights (in Kg) and their frequency distribution of 100 students a...

    Text Solution

    |

  14. The frequency distribution of the number of accidents in 30 consecutiv...

    Text Solution

    |

  15. The frequency distribution of the diameters (in mm) of 80 pipes are gi...

    Text Solution

    |

  16. Find the average of the numbers from the given frequency distribution ...

    Text Solution

    |

  17. The frequency distributions of the quantity (in quintals) of producing...

    Text Solution

    |

  18. The frequency distribution of the monthly incomes (in rupees) of the w...

    Text Solution

    |

  19. The average of weights (in kg) and the number of students of a school ...

    Text Solution

    |

  20. The arithmetic mean of the marks obtained in 8 different subjects in a...

    Text Solution

    |

  21. The average of the collective ages of 4 classes in a school is 8.5 yea...

    Text Solution

    |