


Topper's Solved these Questions
Similar Questions
Explore conceptually related problems
CHETAN PUBLICATION-STATISTICS -ASSIGNMENT -6
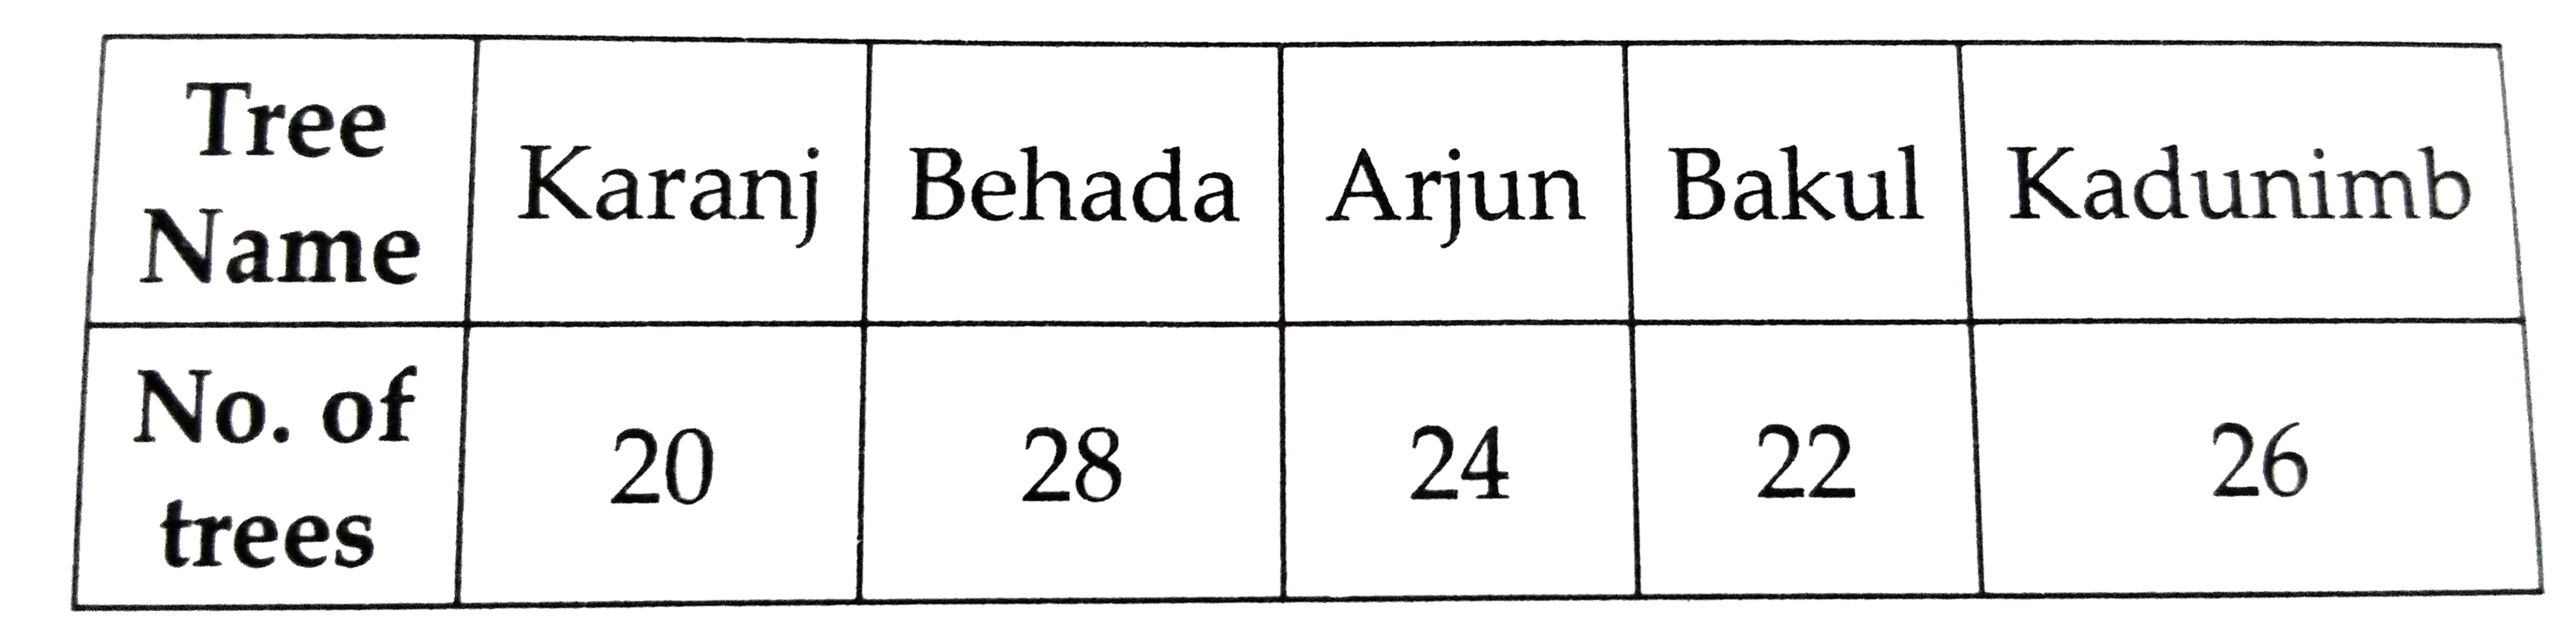
- On an environment day, students in a school planted 120 trees under pl...
Text Solution
|
- Choose the correct alternative among the following : The class mark...
Text Solution
|
- Choose the correct alternative among the following : the class widt...
Text Solution
|
- Choose the correct alternative among the following : The persons of...
Text Solution
|
- Find the missing value
Text Solution
|
- For a certain frequency distribution median class is 129.5 to 134.5 ,f...
Text Solution
|
- Find the measure of central angle for afernoon and Night from the foll...
Text Solution
|
- Find the mean of the following data 12,18,15,17,11,10
Text Solution
|
- Draw a pie chart using the following information
Text Solution
|
- Following is the frequency distribution of students who participated i...
Text Solution
|
- The following frequency distribution shows the no. of persons who visi...
Text Solution
|
- Draw a histogram and frequency polygon of the following data.
Text Solution
|
- The following frequency distribution table gives the ages of 200 patie...
Text Solution
|