Text Solution
Verified by Experts
The correct Answer is:


Topper's Solved these Questions
STATISTICS
CHETAN PUBLICATION|Exercise PRACTICE SET -6.2|4 VideosSTATISTICS
CHETAN PUBLICATION|Exercise PRACTICE SET -6.3|4 VideosSTATISTICS
CHETAN PUBLICATION|Exercise ASSIGNMENT -6|12 VideosSTANDARD IX SYLLABUS
CHETAN PUBLICATION|Exercise PROBLEMS FOR PRACTICE|20 VideosTRIGONOMETRY
CHETAN PUBLICATION|Exercise ASSIGNMENT - 6|11 Videos
Similar Questions
Explore conceptually related problems
CHETAN PUBLICATION-STATISTICS -PRACTICE SET -6.1
- The following table shows the number of students and the time they uti...
Text Solution
|
- A milk centre sold milk to 50 customers. The table below gives the num...
Text Solution
|
- In the following table , the toll paid by drivers and the number of ve...
Text Solution
|
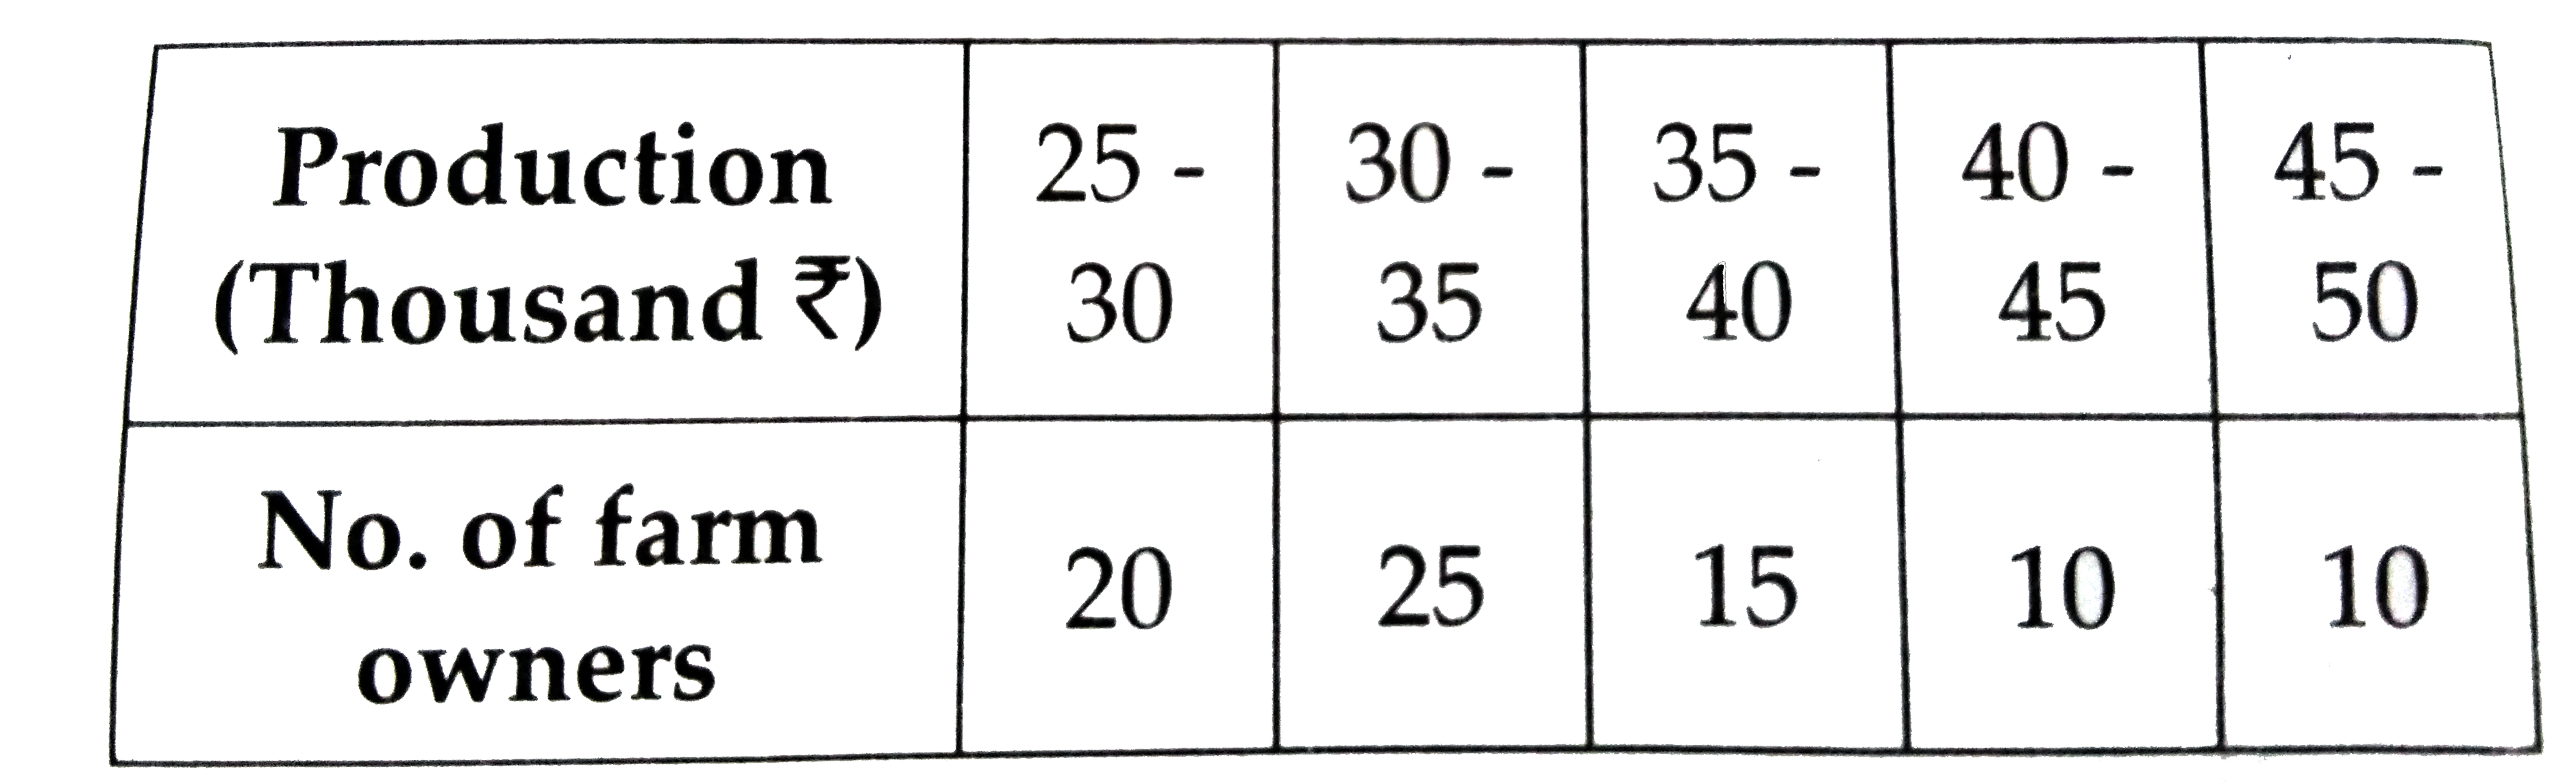
- A frequency distribution table for the production of oranges of some f...
Text Solution
|
- A frequency distribution of funds collected by 120 workers in a compan...
Text Solution
|
- The following table gives the information of frequency distribution of...
Text Solution
|