


Topper's Solved these Questions
STATISTICS
CHETAN PUBLICATION|Exercise PRACTICE SET -6.6|11 VideosSTATISTICS
CHETAN PUBLICATION|Exercise PROBLEM FOR PRACTICE (Based on practice set )|26 VideosSTATISTICS
CHETAN PUBLICATION|Exercise PRACTICE SET -6.4|4 VideosSTANDARD IX SYLLABUS
CHETAN PUBLICATION|Exercise PROBLEMS FOR PRACTICE|20 VideosTRIGONOMETRY
CHETAN PUBLICATION|Exercise ASSIGNMENT - 6|11 Videos
Similar Questions
Explore conceptually related problems
CHETAN PUBLICATION-STATISTICS -PRACTICE SET -6.5
- Observe the following frequency polygon and write the answers of the ...
Text Solution
|
- Observe the following frequency polygon and write the answers of the ...
Text Solution
|
- Observe the following frequency polygon and write the answers of the ...
Text Solution
|
- Observe the following frequency polygon and write the answers of the ...
Text Solution
|
- Observe the following frequency polygon and write the answers of the ...
Text Solution
|
- Show the following data by a frequency polygon .
Text Solution
|
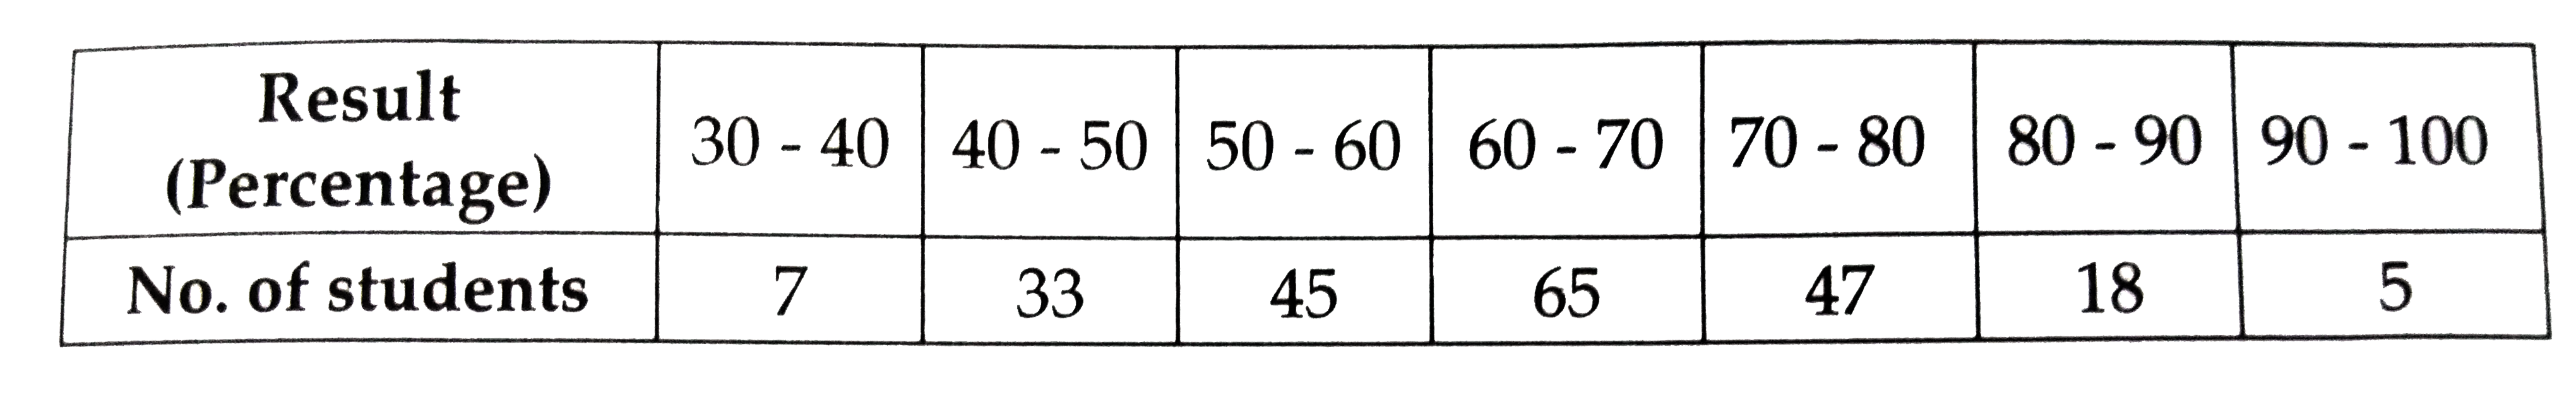
- The following table shows the classification of percentages of marks o...
Text Solution
|