Text Solution
Verified by Experts
The correct Answer is:


Topper's Solved these Questions
Similar Questions
Explore conceptually related problems
CHETAN PUBLICATION-STATISTICS -PROBLEM FOR PRACTICE (Based on practice set )
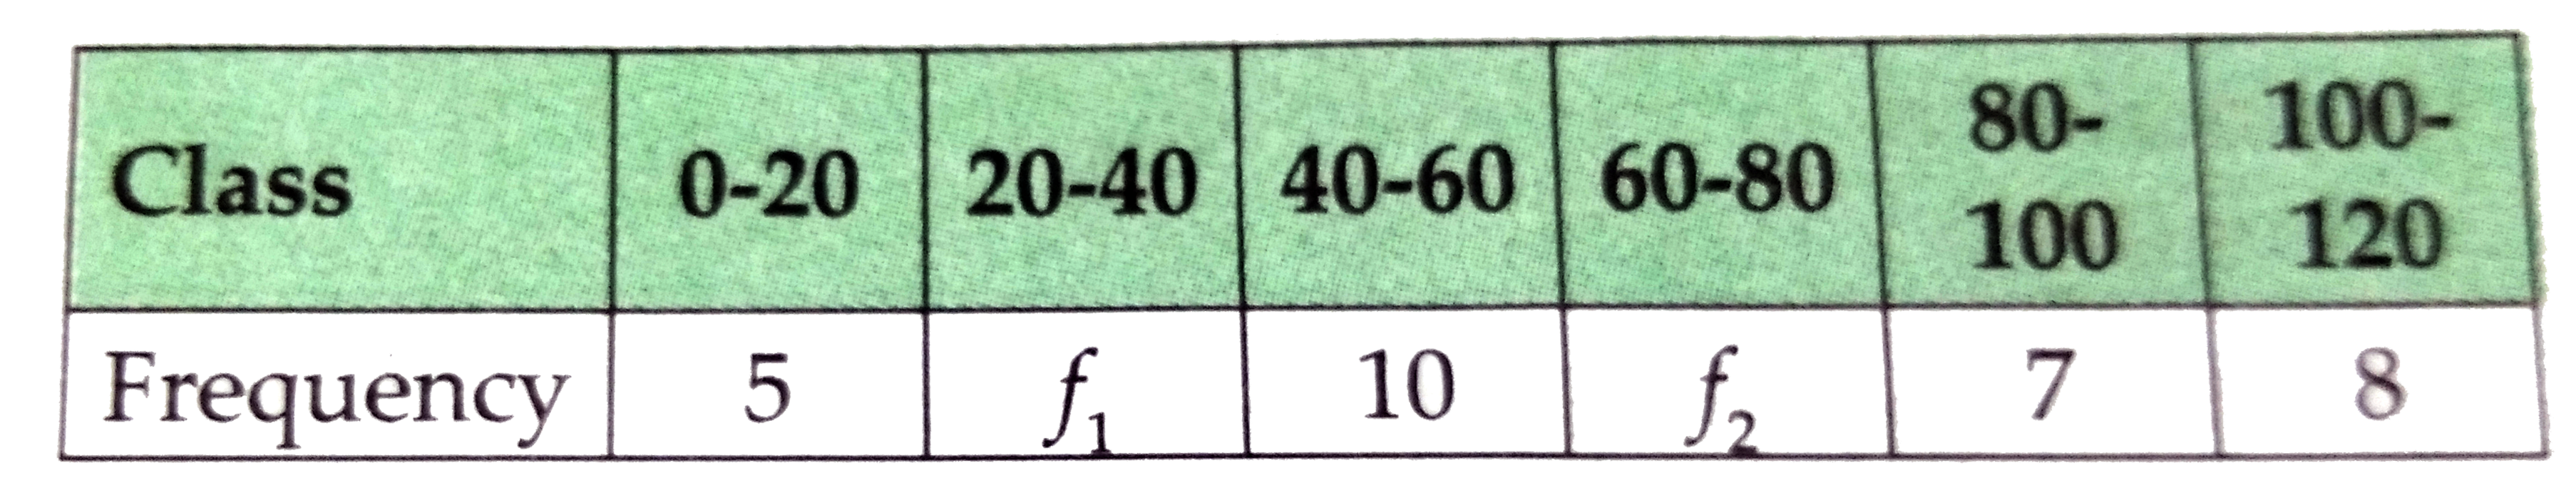
- The following table gives the distribution of total household expendi...
Text Solution
|
- Rainfall (in mm) recorded in 50 cities in a partial region on a part...
Text Solution
|
- The mean of the following frequency distribution is 62.8 and the sum o...
Text Solution
|
- The following table shows the ages of 300 patients getting medical tre...
Text Solution
|
- Below is given the frequency distribution of no. of packages received...
Text Solution
|
- Following table shows frequency distribution of no. of rooms occupied ...
Text Solution
|
- Time spent in queue by 100 passenger is classified and given below . ...
Text Solution
|
- Following is the cumulative frequency distribution of empolyees in a ...
Text Solution
|
- Automatic filling machine was liseted for its performance. A sample 10...
Text Solution
|
- The following table gives profit earned by companeies in lacs . ...
Text Solution
|
- The following table shows the heights of students . Find the mo...
Text Solution
|
- Below is given the frequency distribution of Daily wages (in rs ) of 1...
Text Solution
|
- The following is the frequency distribution of blood pressure measure...
Text Solution
|
- Draw the frequency polygon for the following data.
Text Solution
|
- Below is given frequency distribution of marks (out of 100 ) obtained...
Text Solution
|
- Draw the frequency polygond using mid-ponts for the following data on ...
Text Solution
|
- Draw a pie diagram to represent the world population given in the fol...
Text Solution
|
- The following table shows the expenditure incurrd by a publisher in pu...
Text Solution
|
- Following is the breakup of expenditure of a family on different times...
Text Solution
|
- The following pie diagram represents the number of valid votes obtaine...
Text Solution
|