A
B
C
D
Text Solution
Verified by Experts
The correct Answer is:


Topper's Solved these Questions
ENVIRONMENTAL CHEMISTRY
A2Z|Exercise Section B - Assertion Reasoning|14 VideosENVIRONMENTAL CHEMISTRY
A2Z|Exercise AIPMT/NEET Questions|10 VideosCLASSIFICTION, PURIFICATION AND NOMENCLATURE OF ORGANIC COMPOUNDS
A2Z|Exercise Section D - Chapter End Test|30 VideosHYDROCARBONS
A2Z|Exercise Section D - Chapter End Test|30 Videos
Similar Questions
Explore conceptually related problems
A2Z-ENVIRONMENTAL CHEMISTRY-Section D - Chapter End Test
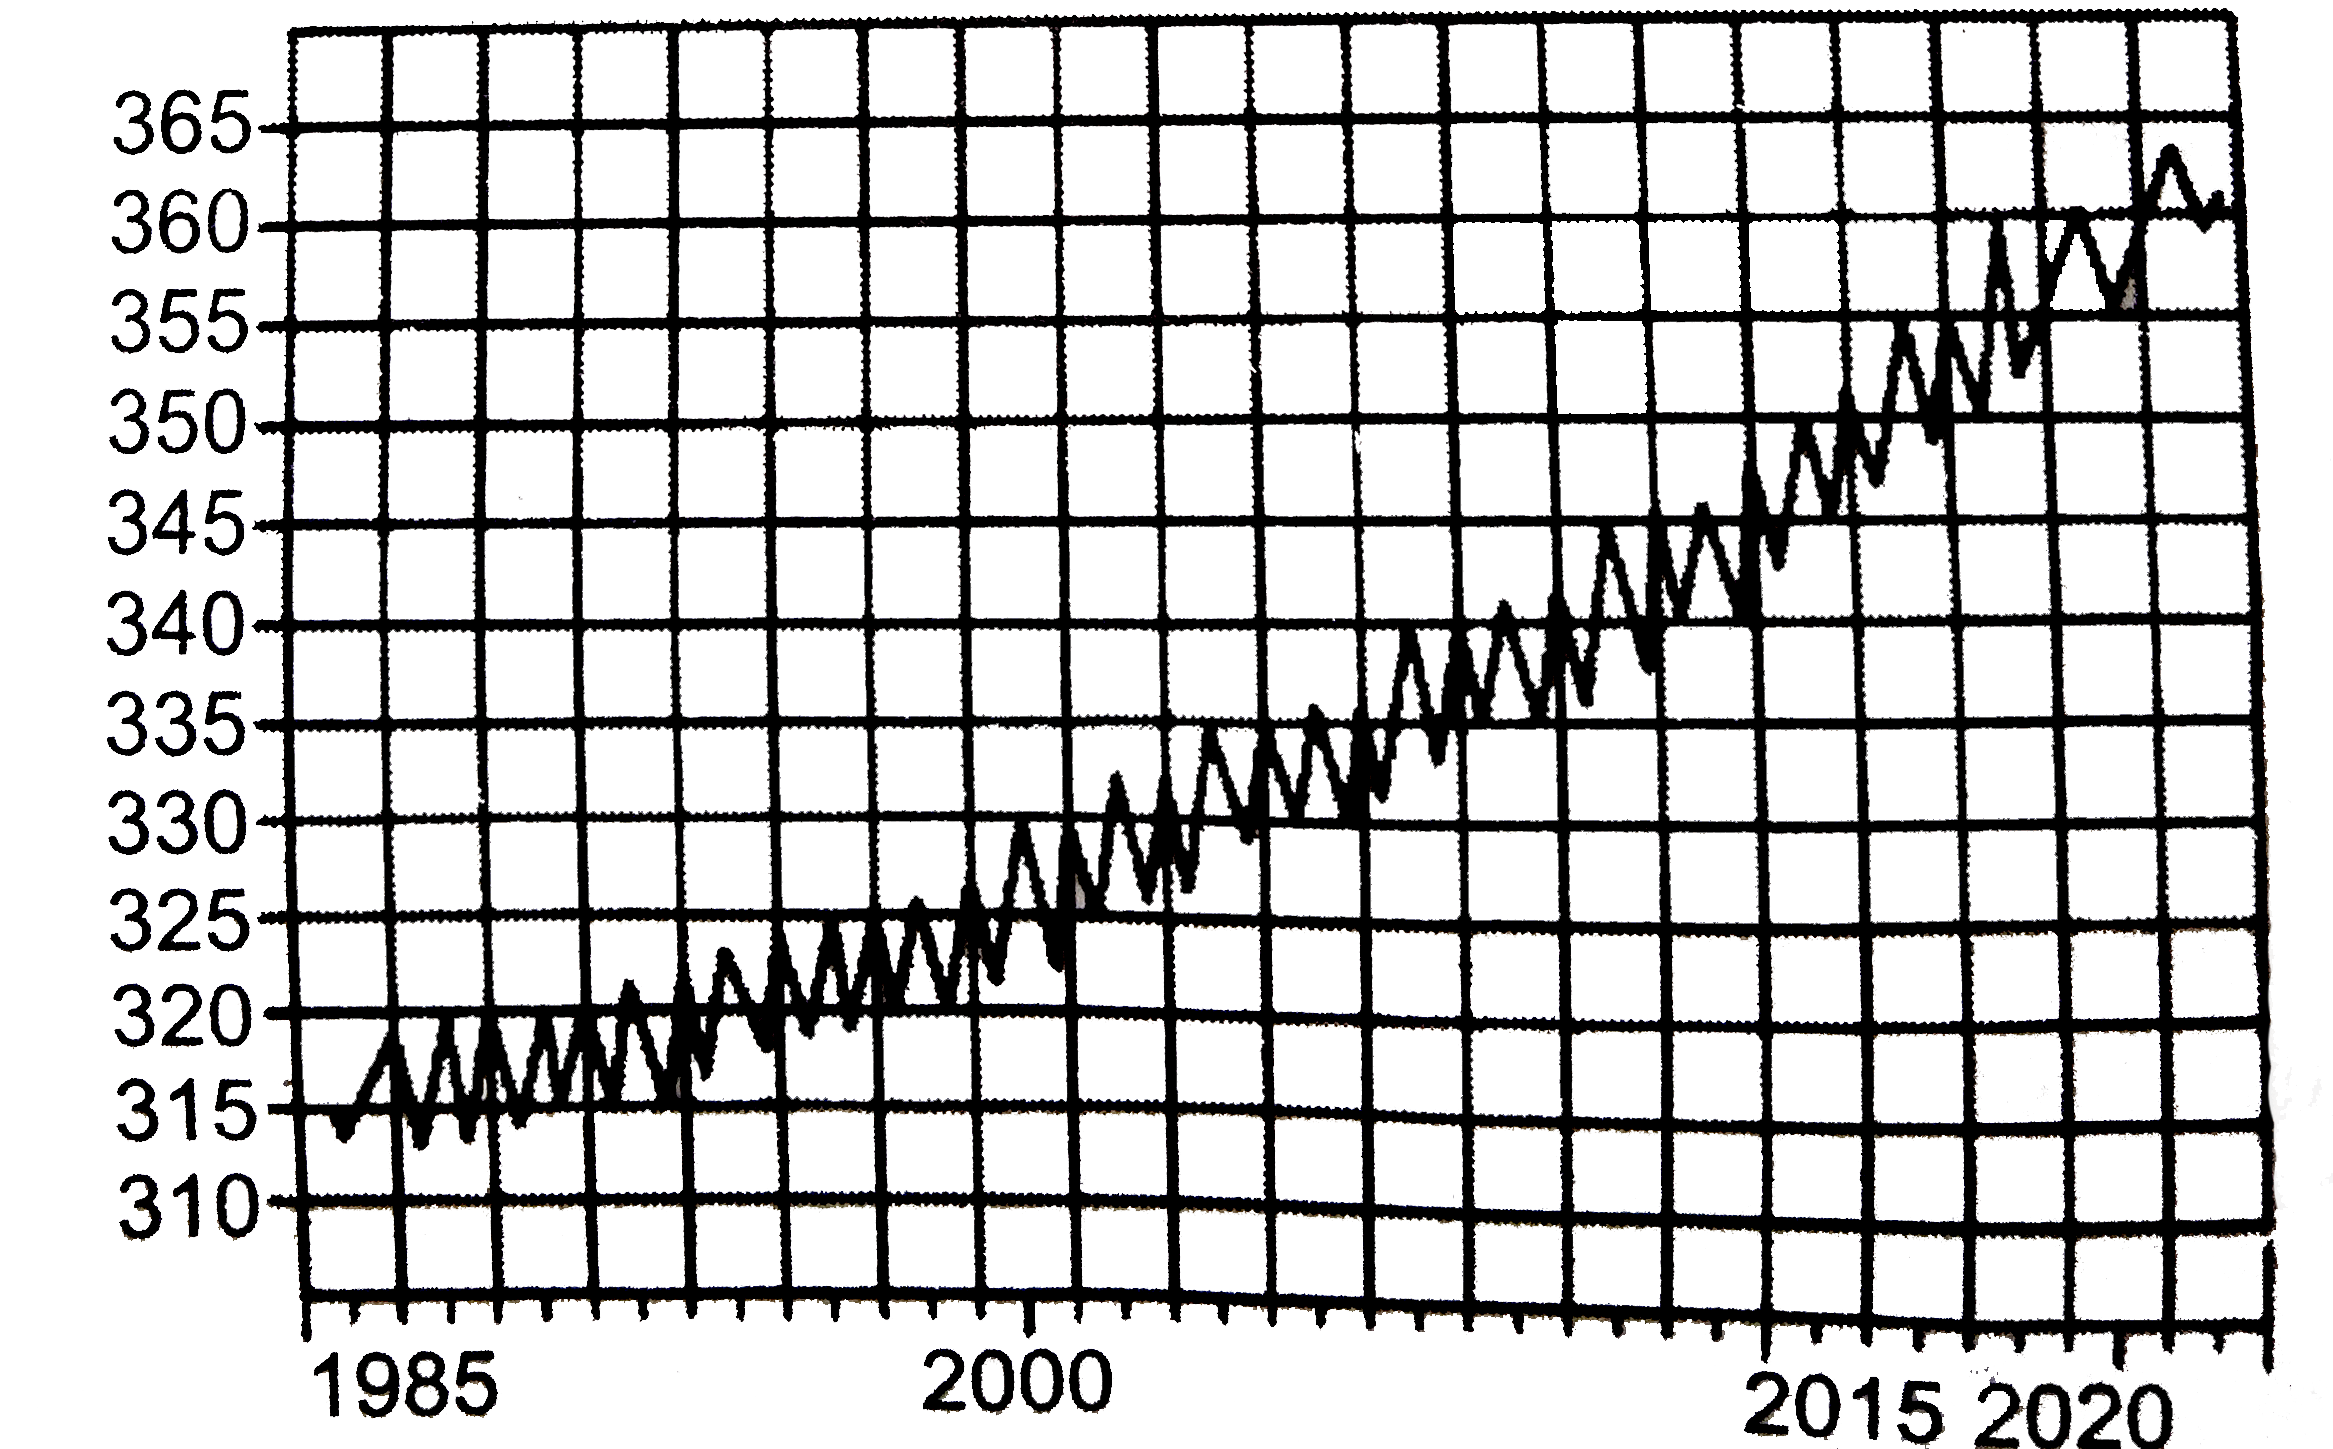
- The figure shows increase in CO(2) content (ppm) from 1985 to 2015 in ...
Text Solution
|
- When polluted air is scrubbed with H(2)SO(4) solution,
Text Solution
|
- Negative soil pollutant is
Text Solution
|
- Which of the following chemical, harmful to ozone , released by chloro...
Text Solution
|
- Which of the following statement about sewage treatment is false?
Text Solution
|
- Oxides of sulphur and nitrogen can be removed by scrubbing with
Text Solution
|
- Which of the following in not an example of green chemistry?
Text Solution
|
- Which of the following is the coldest region of atmosphere
Text Solution
|
- Most hazardous metal pollutant of automobile exhausts is :
Text Solution
|
- NO and H(2)S both the pollutants of air. NO is H(2)S remover while H(2...
Text Solution
|
- The region which is greatly affected by air pollution is
Text Solution
|
- Classical smog occurs in places of :
Text Solution
|
- Which of the following is not a herbicide?
Text Solution
|
- Which of the following is not involved in the formation of photochemic...
Text Solution
|
- Which is not the constituent of photochemical smog?
Text Solution
|
- DDT is
Text Solution
|
- Smog can be controlled by
Text Solution
|
- Domestic waste mostly constitute:
Text Solution
|
- The gas leaked from a stronge tank of the Union Carbide plant in Bhopa...
Text Solution
|
- Which is not correct statement for classical smog?
Text Solution
|
- Which of the following is the primary precursor of photochemical smog?
Text Solution
|