A
B
C
D
Text Solution
Verified by Experts
The correct Answer is:


Similar Questions
Explore conceptually related problems
Recommended Questions
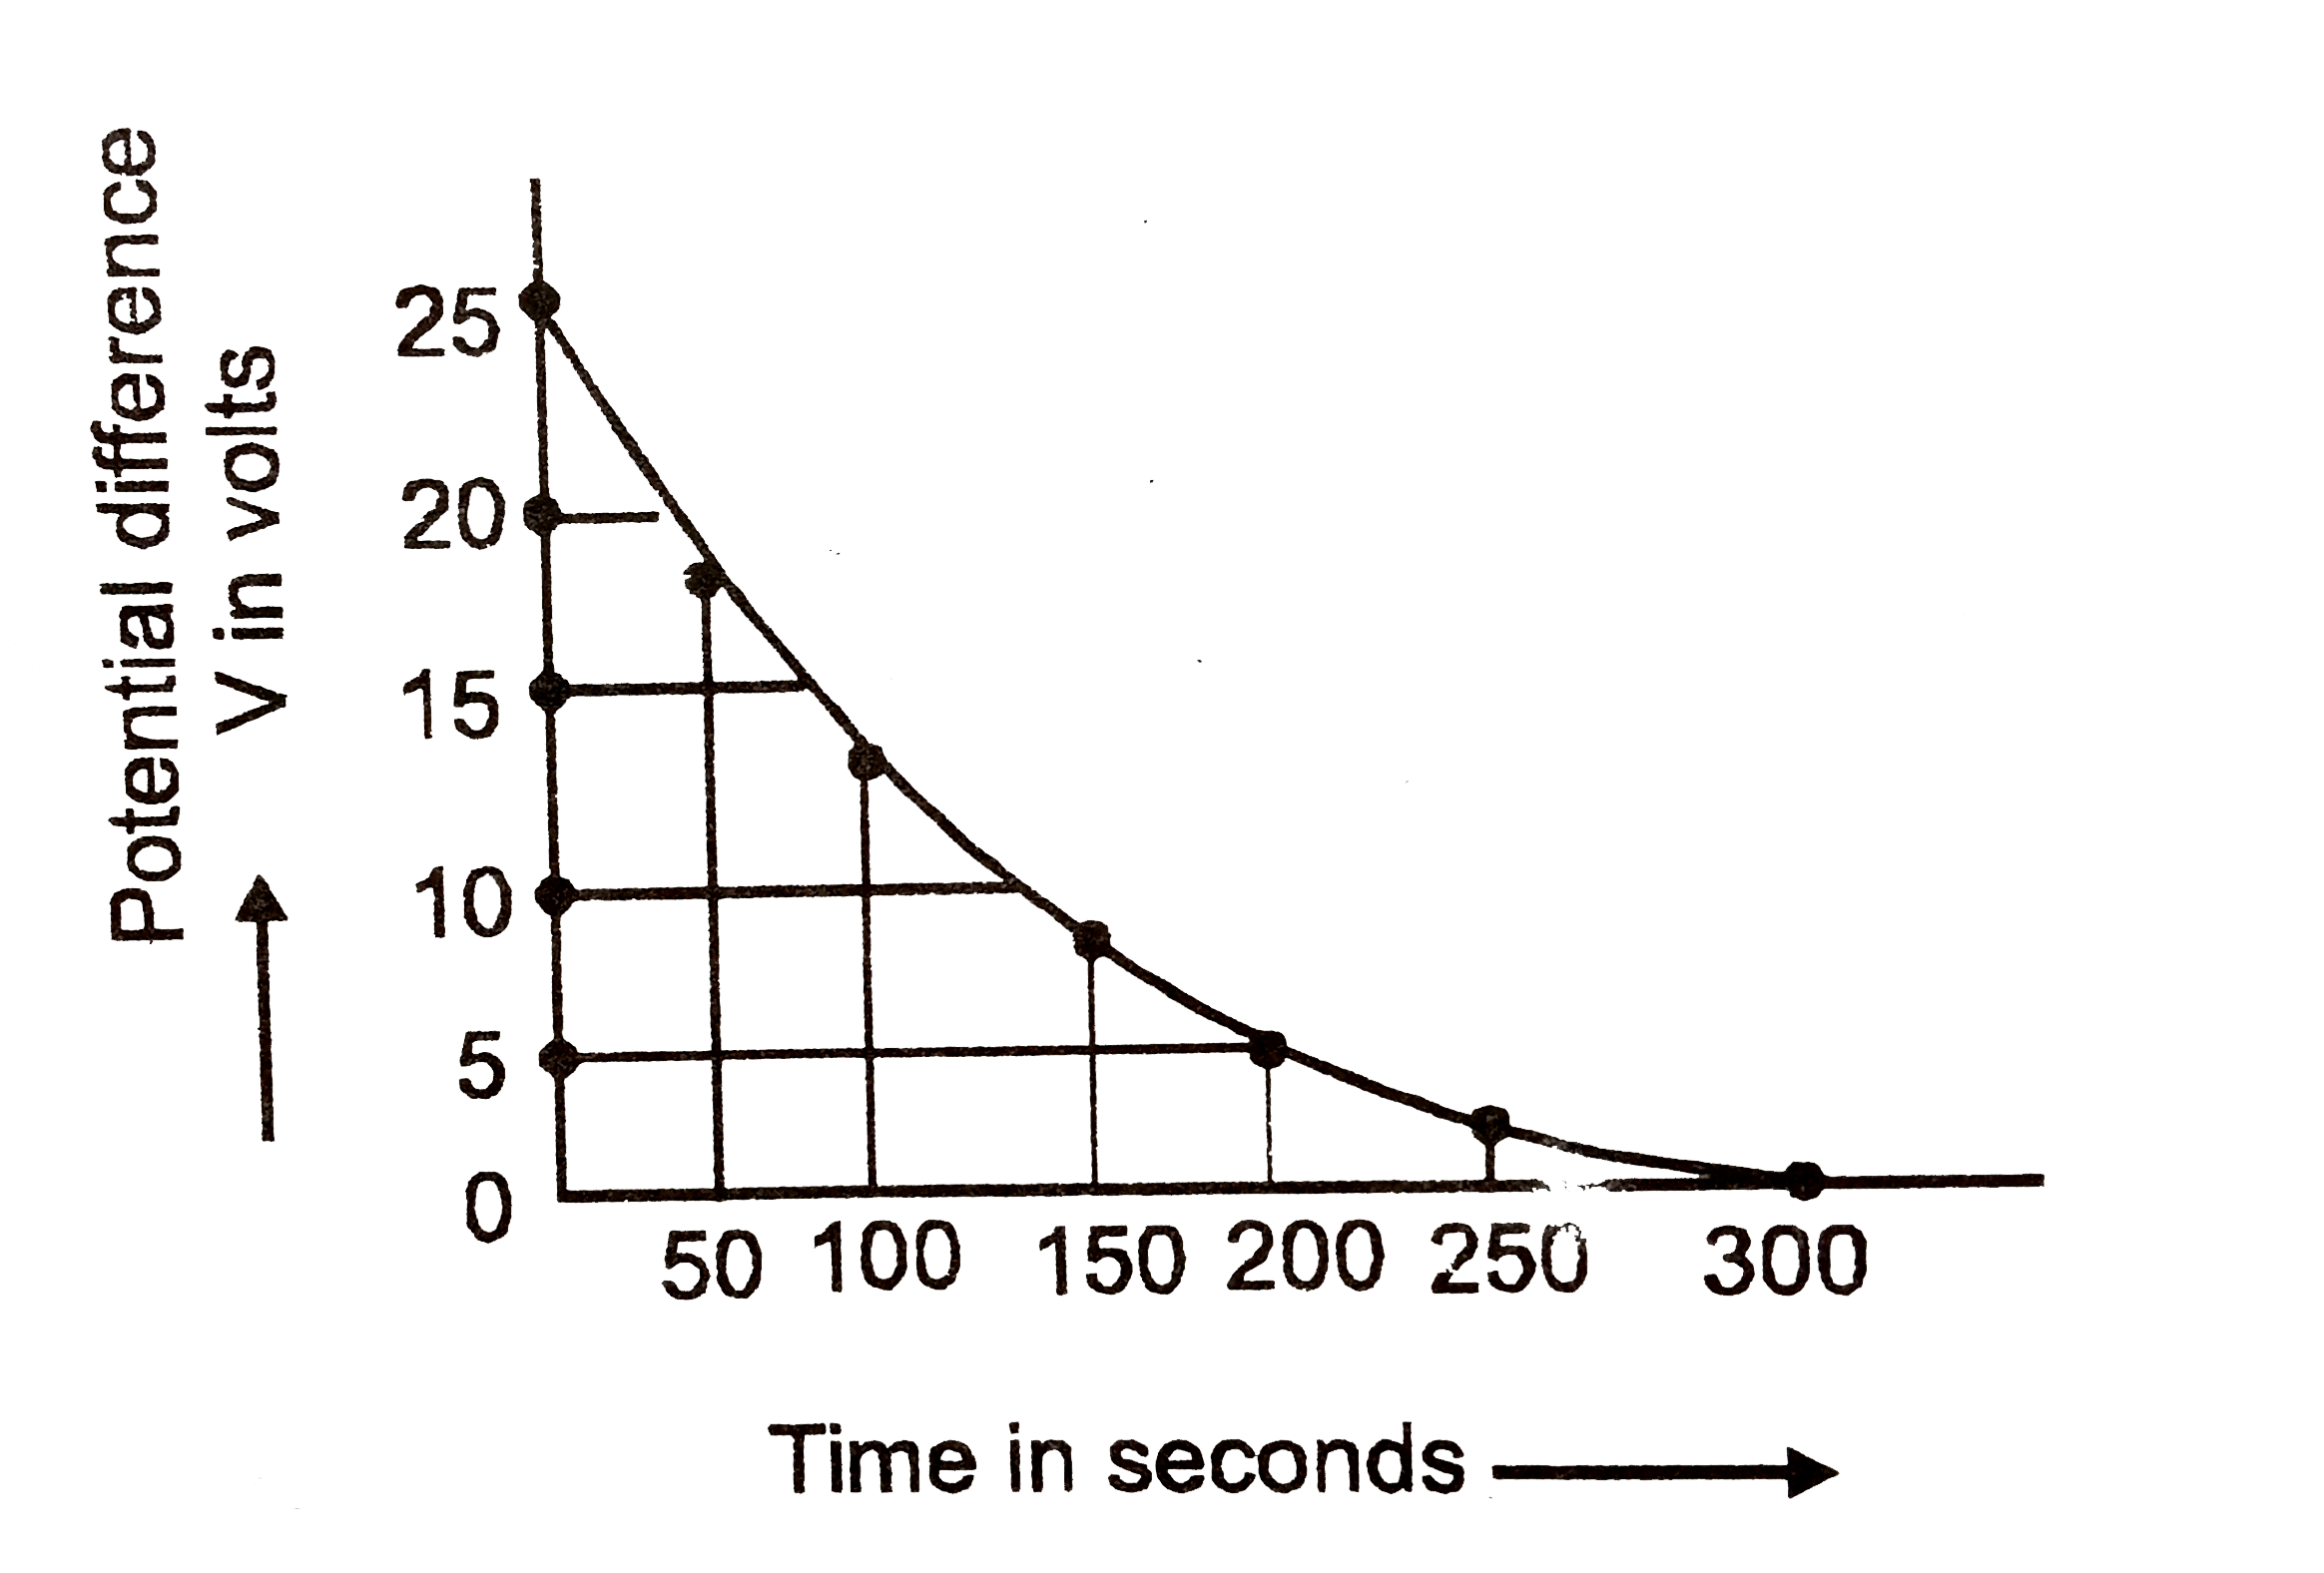
- The figure shows an experimental plot discharging of a capacitor in an...
Text Solution
|
- How many time constants will elapse before the charge on a capacitor f...
Text Solution
|
- The capacitive time constant of the RC circuit shown in the figure is
Text Solution
|
- The capacitive time constant of the RC circuit shown in the figure.
Text Solution
|
- The figure shows an experimental plot discharging of a capacitor in an...
Text Solution
|
- Discharging of RC Circuits and its characteristics
Text Solution
|
- चित्र एक R-C परिपथ में संधारित्र के अनावेशित होने का प्रयोगिक आरेख दर्...
Text Solution
|
- चित्र R-C परिपथ में संधारित्र के अनावेशित होने का प्रयोगिक प्लाट दर्शा...
Text Solution
|
- Find the current as a function of time in case of (a) charging and (b)...
Text Solution
|