Home
Class 12
PHYSICS
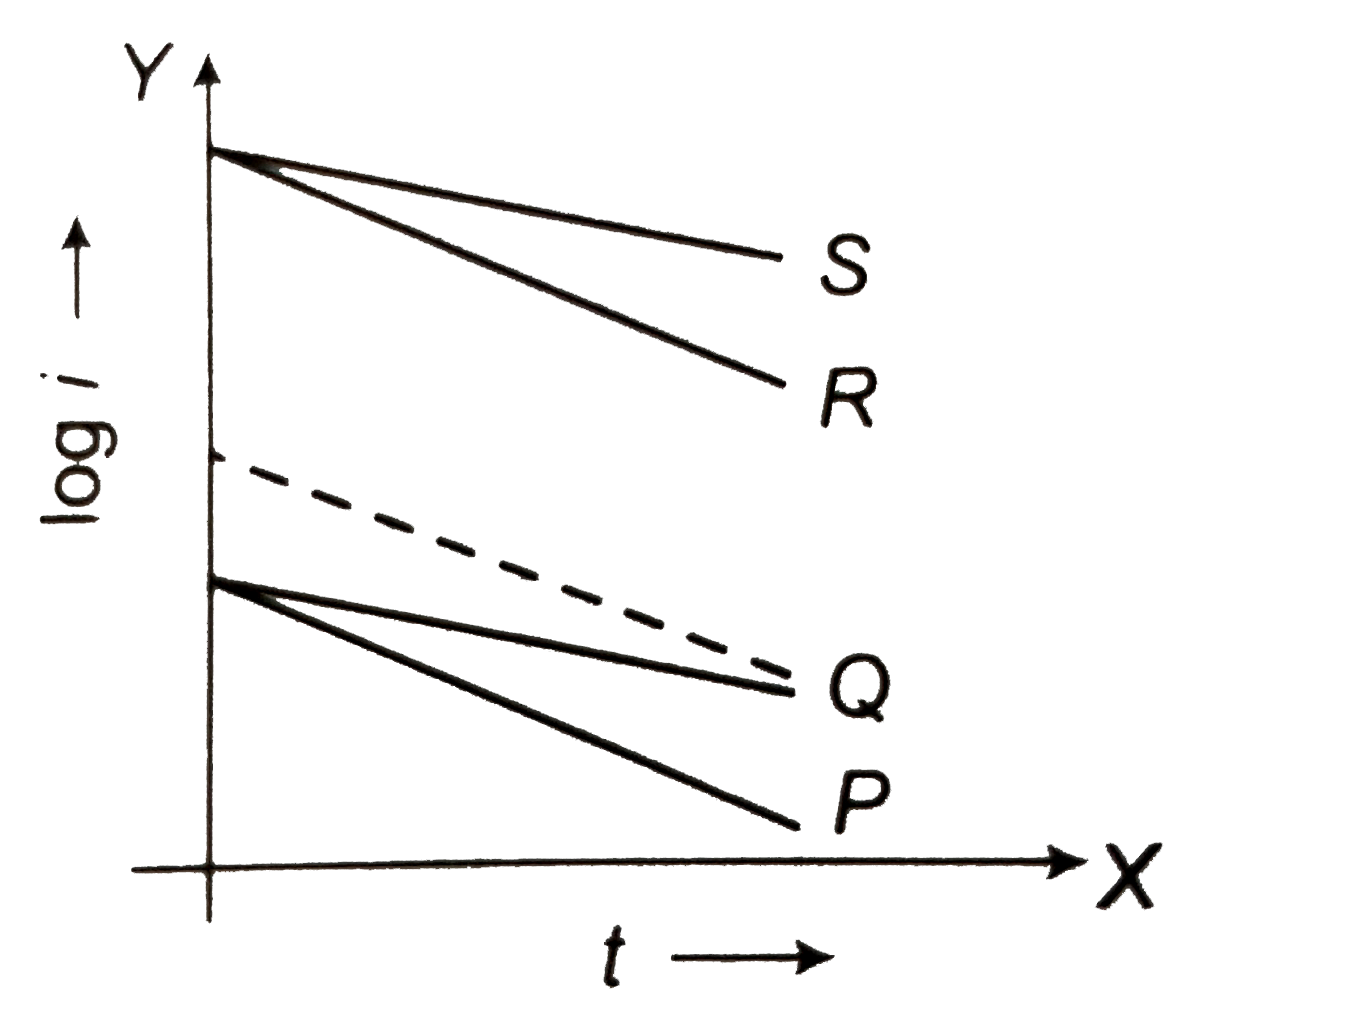
In an RC circuit while charging, the gra...

In an `RC` circuit while charging, the graph of `1n i` versis time is as shown by the dotted line in the diagram figure. Where `i` is the current. When the value of the resistance is doubled, which of the solid curve best represents the variation of `1n i` versus time

Text Solution

Verified by Experts

The correct Answer is:
B

During charging
`Q = Q_(0) (1-e^(-t//RC)) = CV (1-e^(-t//RC))`
`I = (-CVe^(-t//RC)) xx -(1)/(R ) e^(-t//RC)`
`lnI = ln (V)/(R)-(t)/(RC ) rArr lnI =- (t)/(RC )+ln (V)/(R )`
slop and intercept both decreases.
Promotional Banner

Similar Questions

Explore conceptually related problems

Switch S of the circuit shows in Fig. is closed at t = 0 . If e denotes the induced emf in L and i the current flowing through the circuit at time t , then which of the following graphs correctly represents the variation of e with i ?

In the circuit shown in the figure . The value of current I_1 is

The figure represents the voltage applied across a pure inductor. The diagram which correctly represents the variation of curent i with time t is given by .

When an electric heater is switched on, the current flowing through it ( i ) is plotted against time ( t ). Taking into account the variation of resistance with temperature, which of the following best represents the resulting curve

In an L-R circuit connected to a battery of constant emf E, switched is closed at time t=0. If denotes the induced emf across inductor and I the current in the circuit at any time t. Then which of the following graphs shown the variation of e with i?

The current in a certain circuit varies with time as shown in figure. Find the average current and the rms current in terms of I_0 .

In the circuit shown in figure when the input voltage of the base resistance is 10 V . Find the values of I_b , I_c and beta .

In the circuit as shown in figure, the ratio of current i_1//i_2 is