Text Solution
Verified by Experts


Similar Questions
Explore conceptually related problems
Recommended Questions
- The graph below represents the velocity vs. time graph for a car. ...
Text Solution
|
- The graph below represents the velocity vs. time graph for a car. ...
Text Solution
|
- The velocity-time graph of a body is shown in figure. The ratio of mag...
Text Solution
|
- A car is moving on a straight road. The velocity of the car varies wit...
Text Solution
|
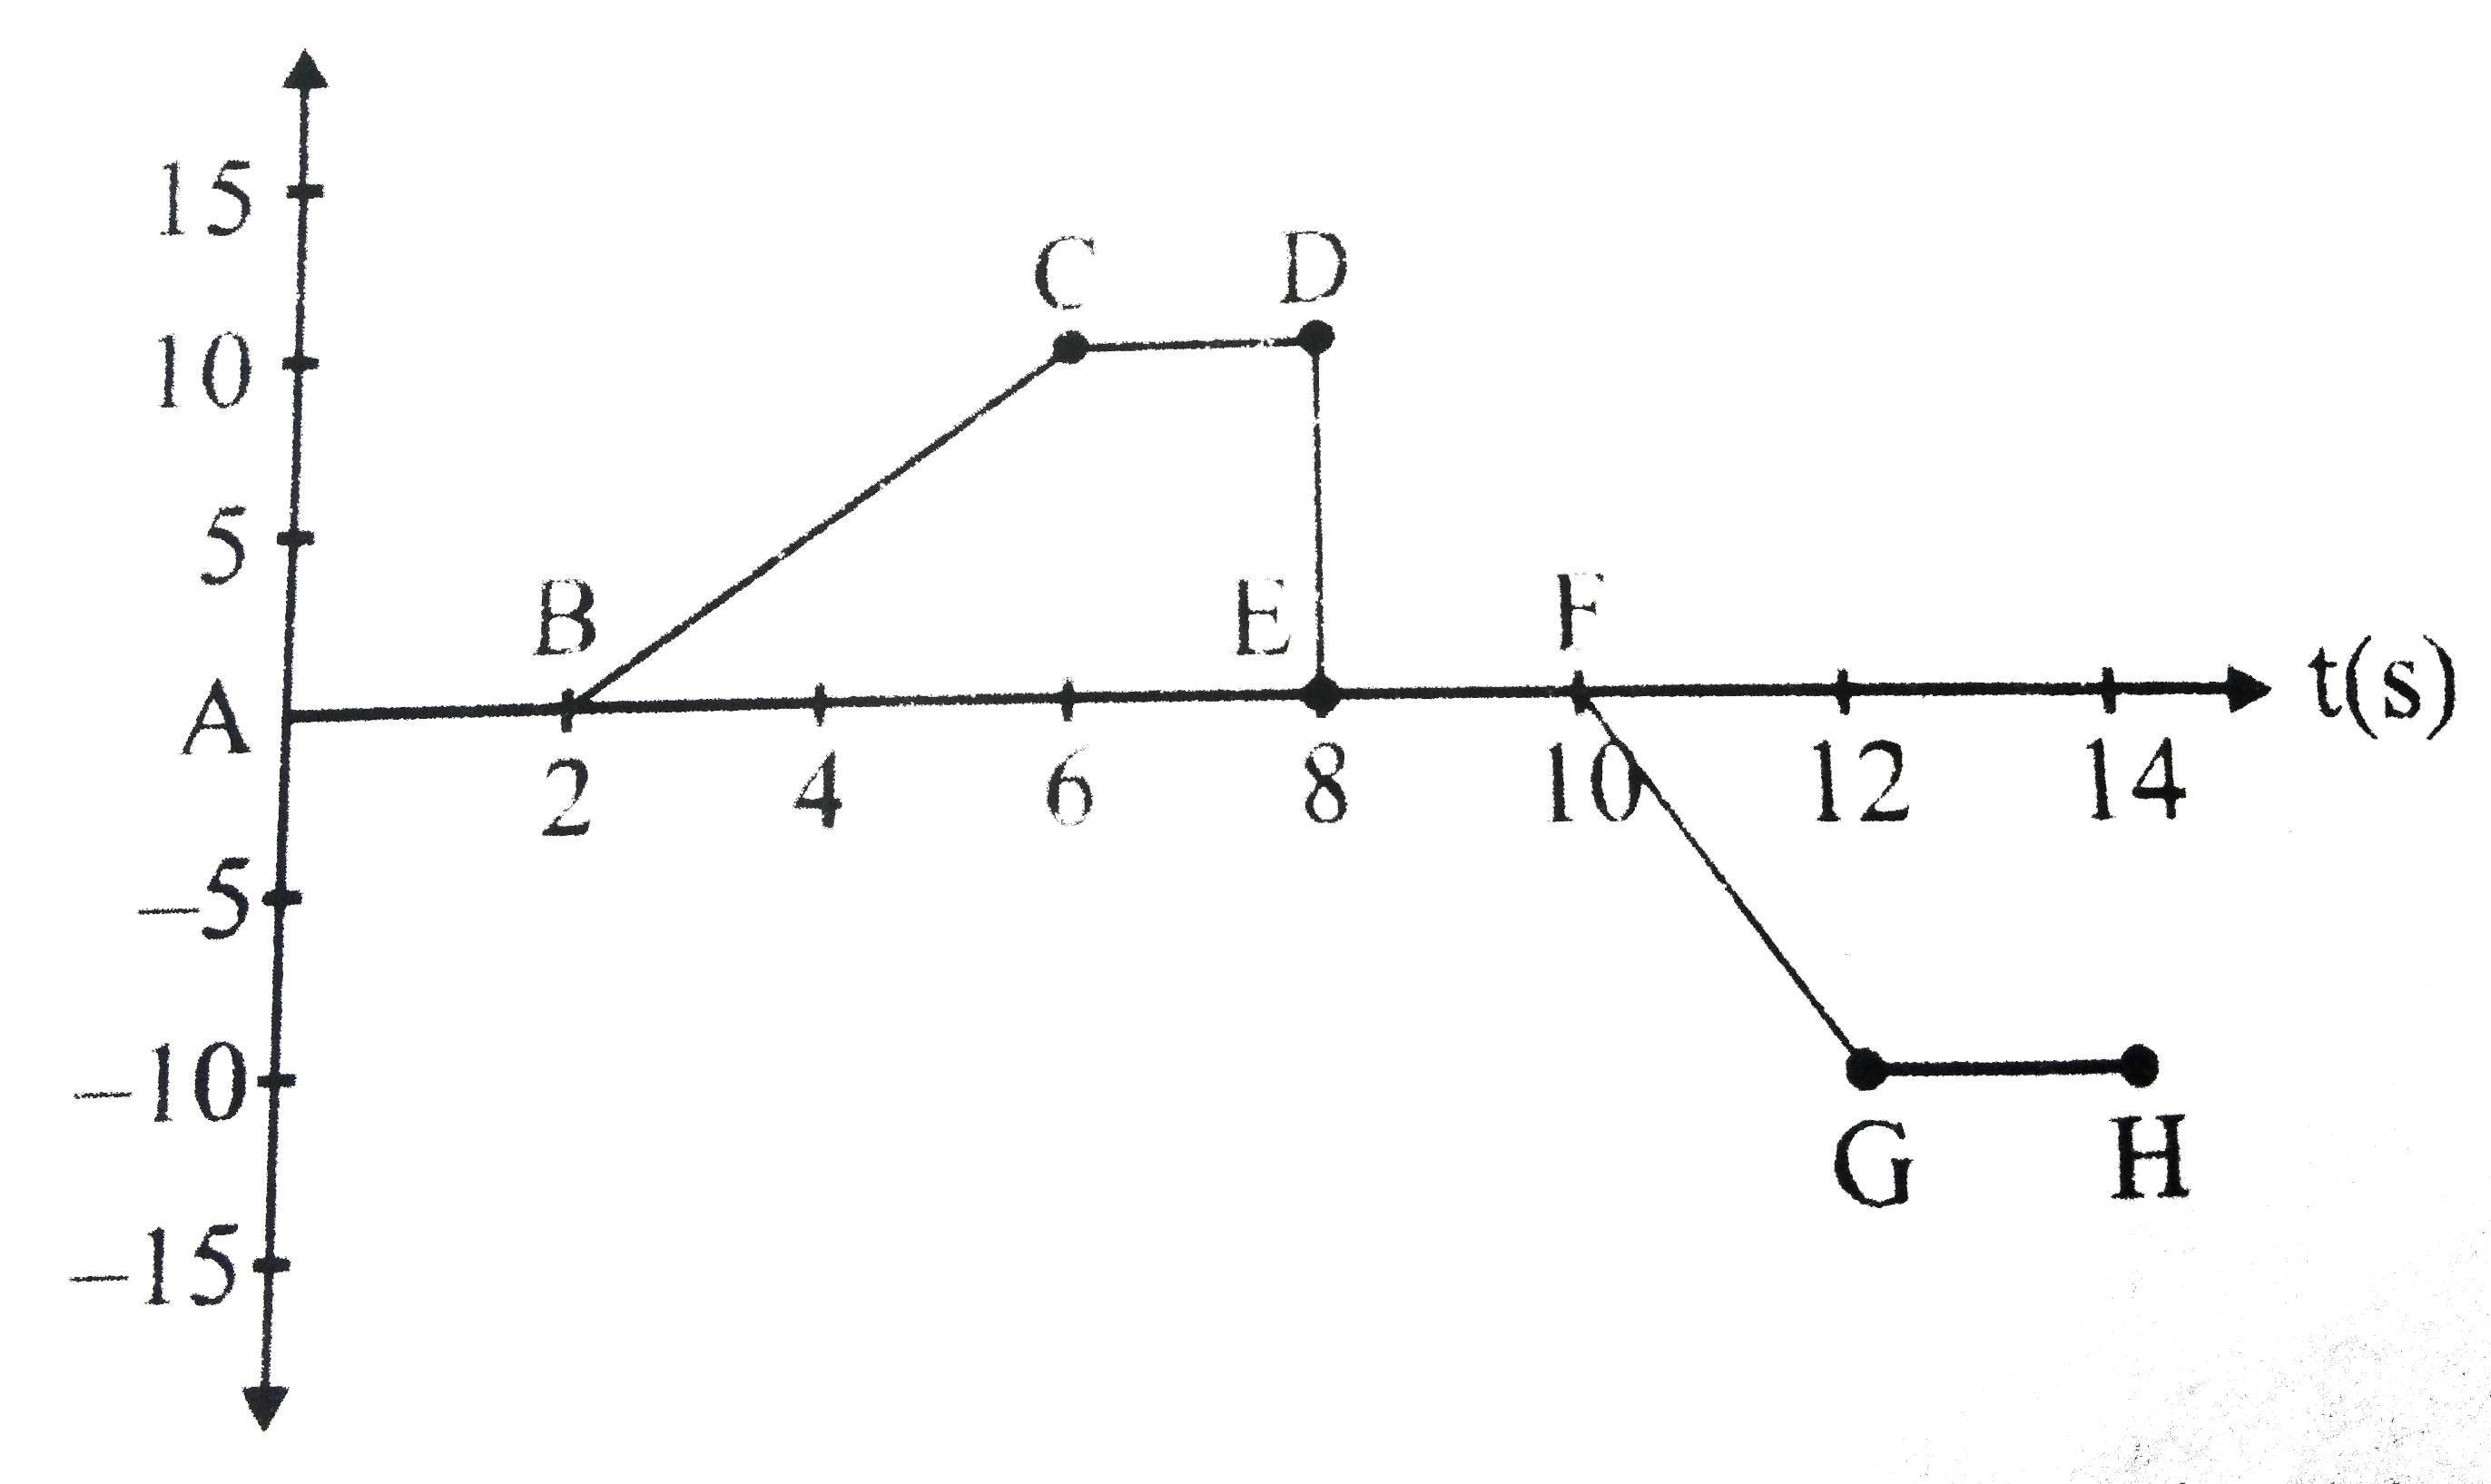
- The velocity- time graph of car moving on a straight track is given be...
Text Solution
|
- The velocity- time graph of car moving on a straight track is given be...
Text Solution
|
- A car moves on a circular road. It describes equal angles about the ce...
Text Solution
|
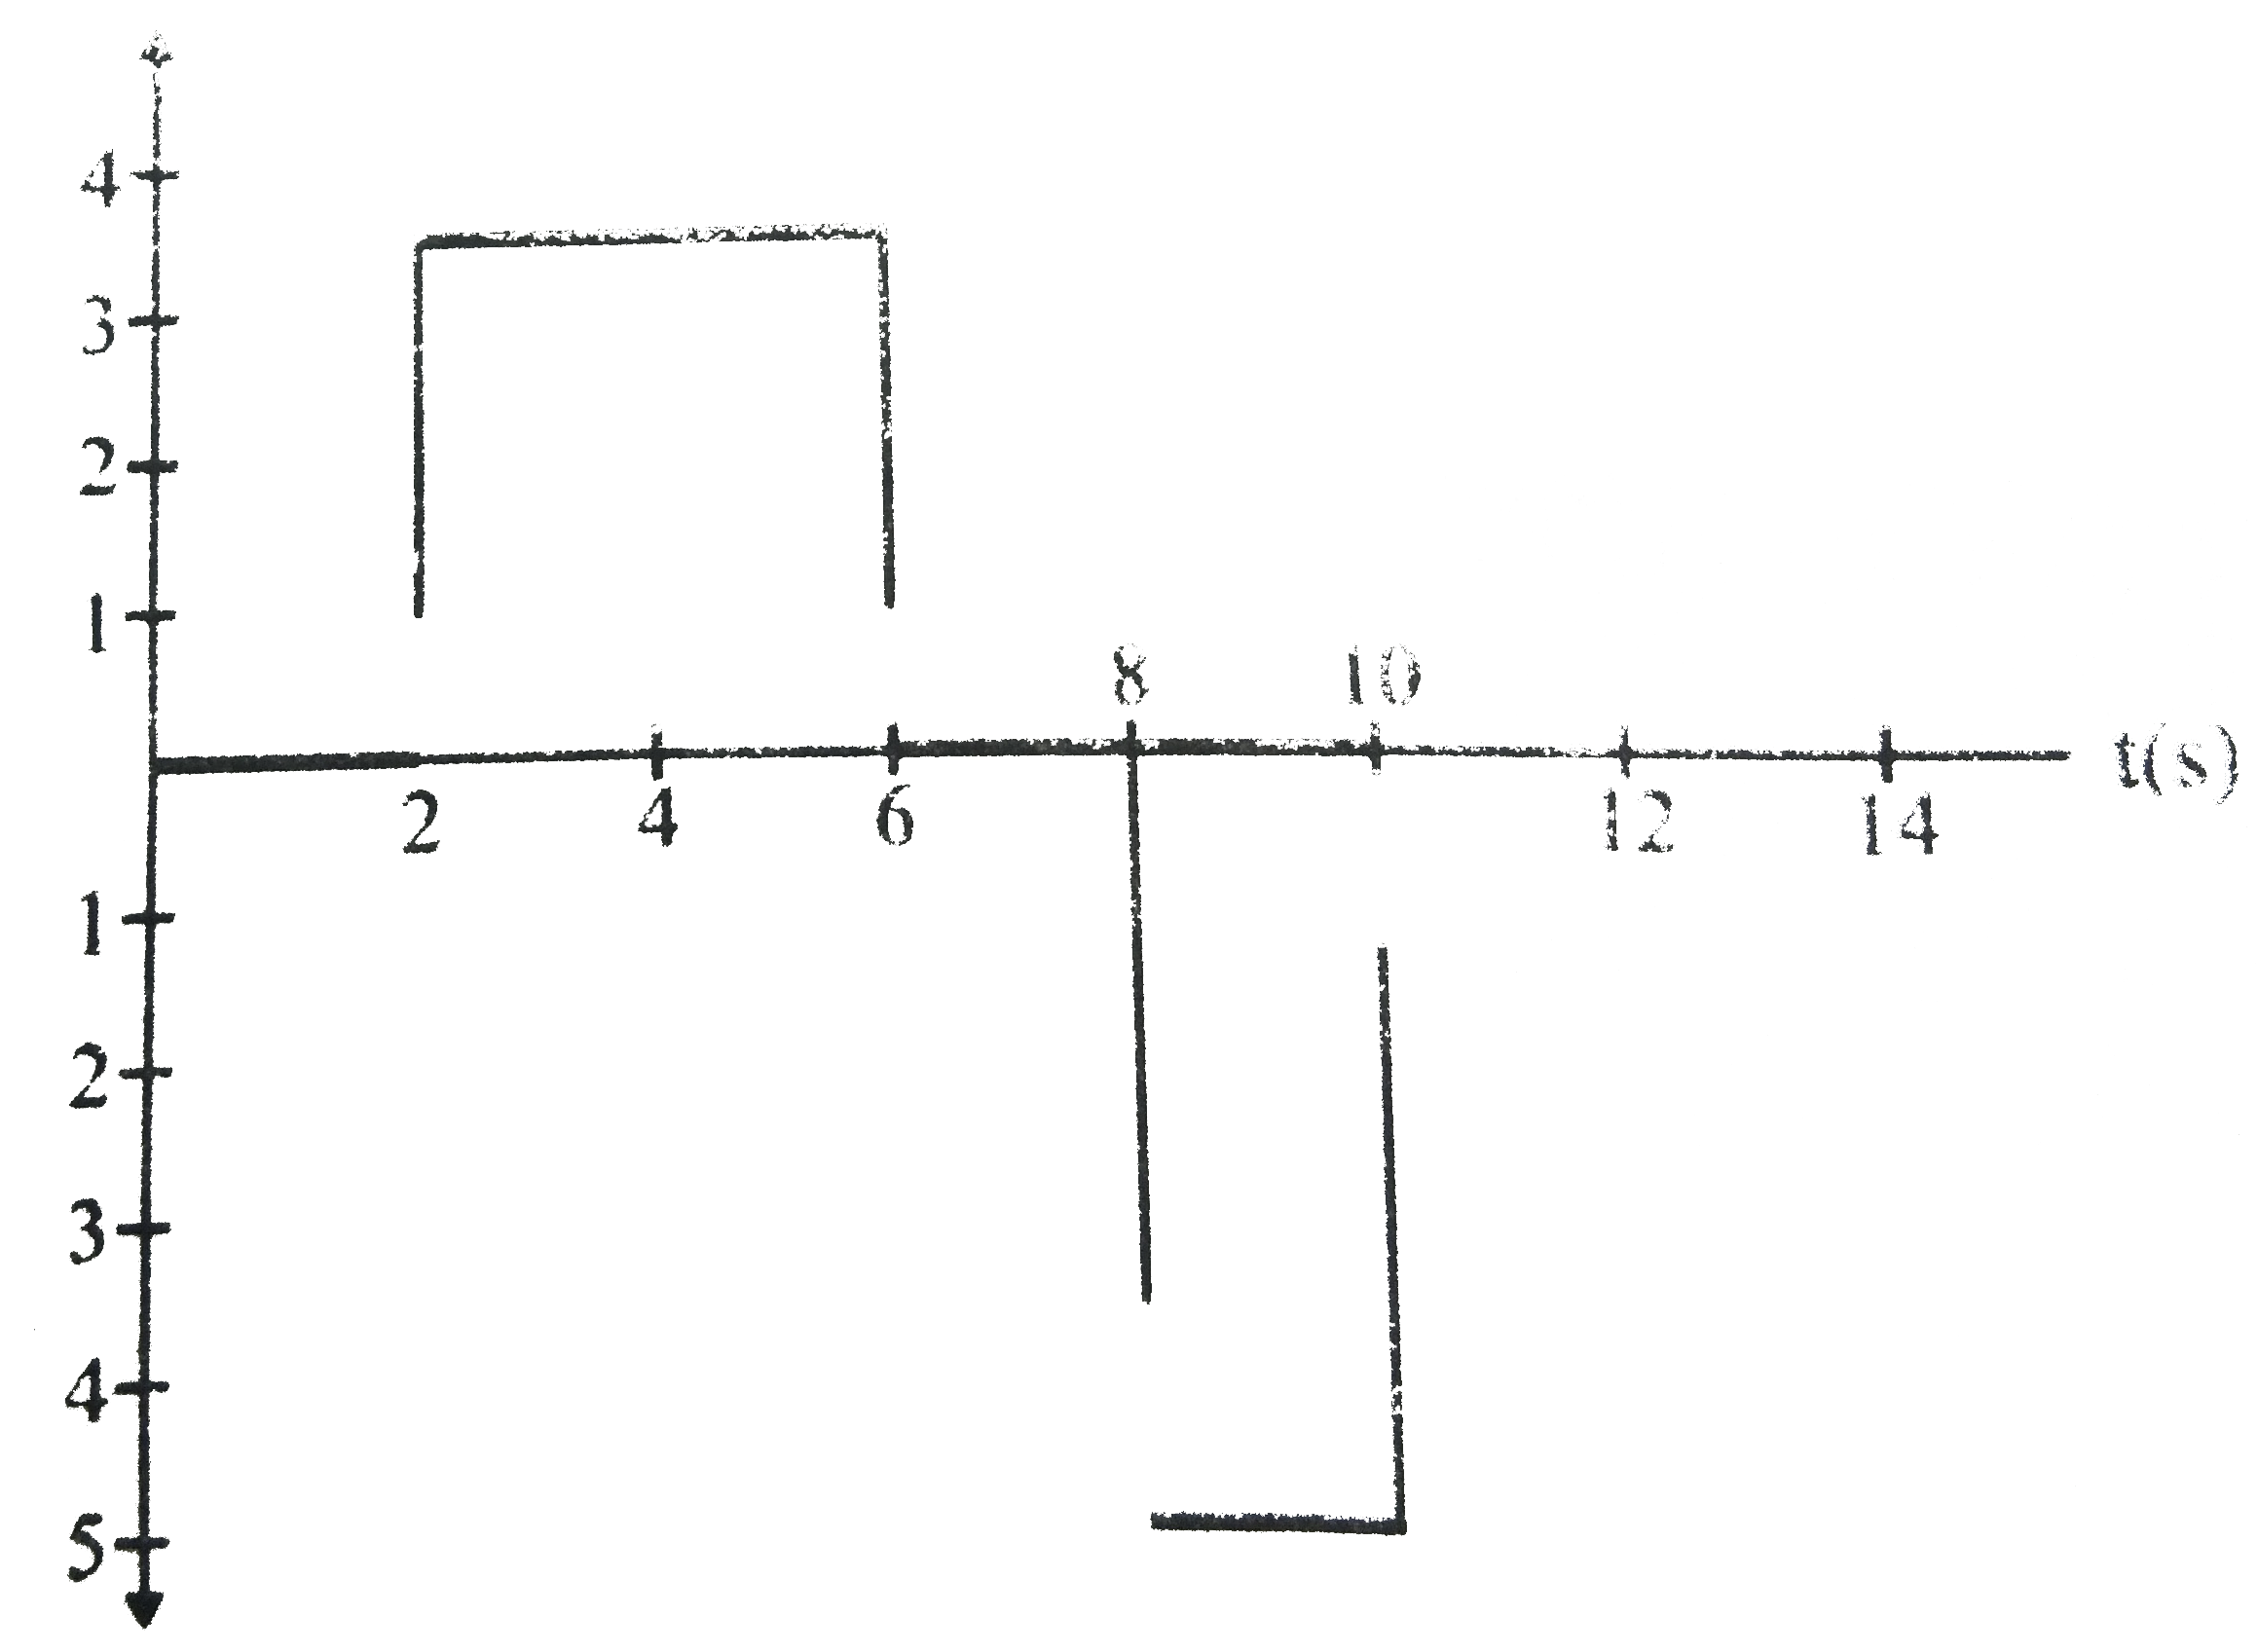
- The variation in the speed of a car during its two hour journey is sho...
Text Solution
|
- A car, starting from rest, has a constant acceleration for a time inte...
Text Solution
|