A
B
C
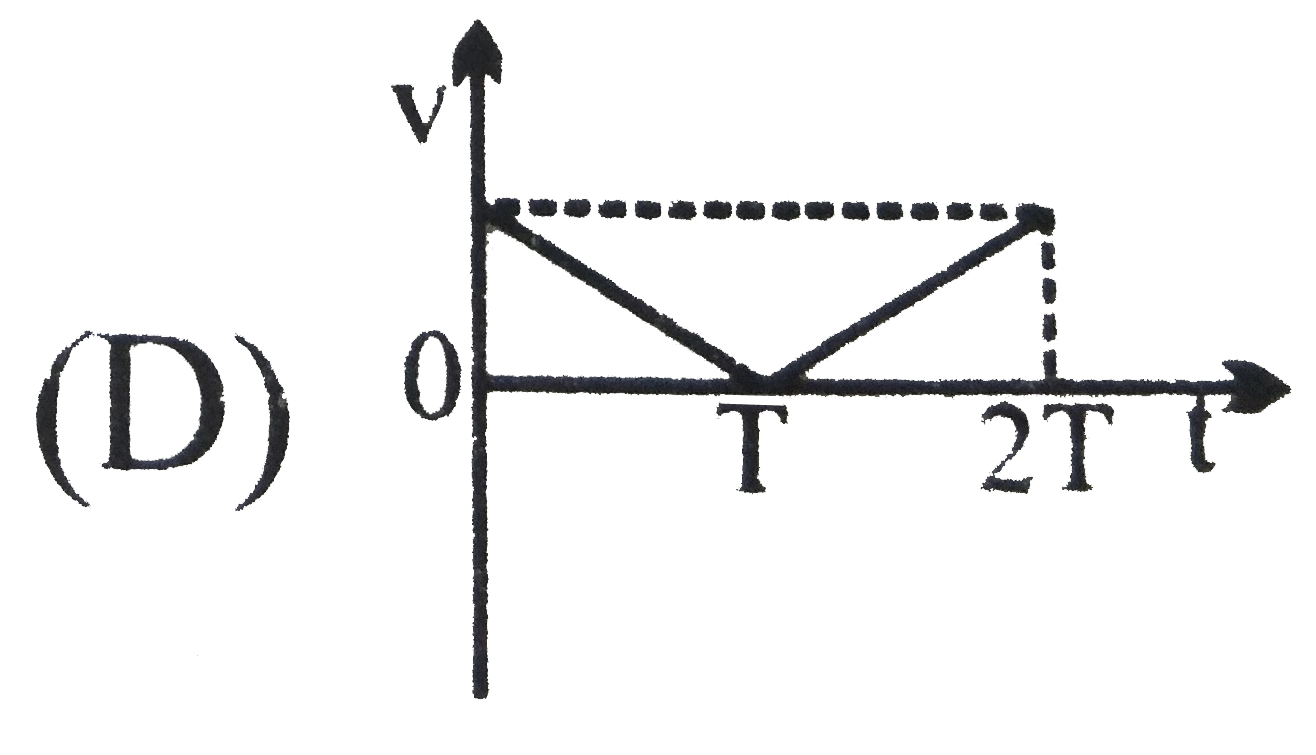
D
Text Solution
Verified by Experts
The correct Answer is:


Similar Questions
Explore conceptually related problems
Recommended Questions
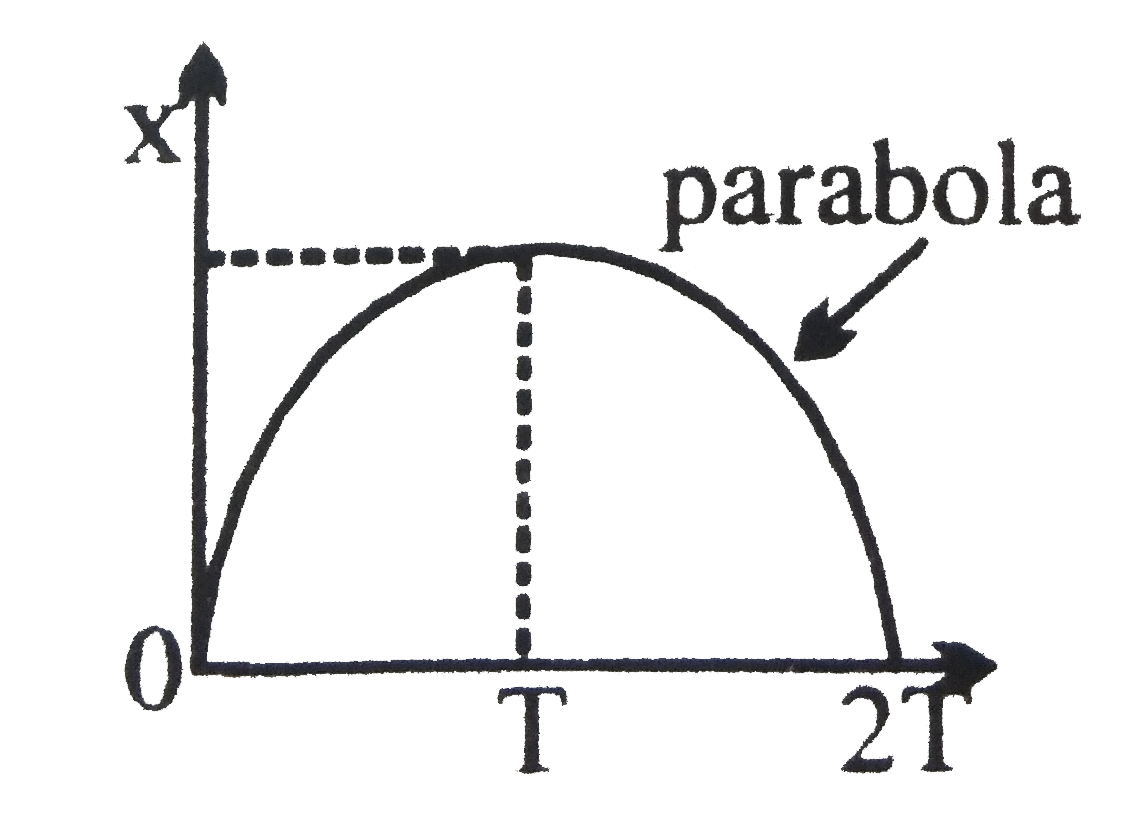
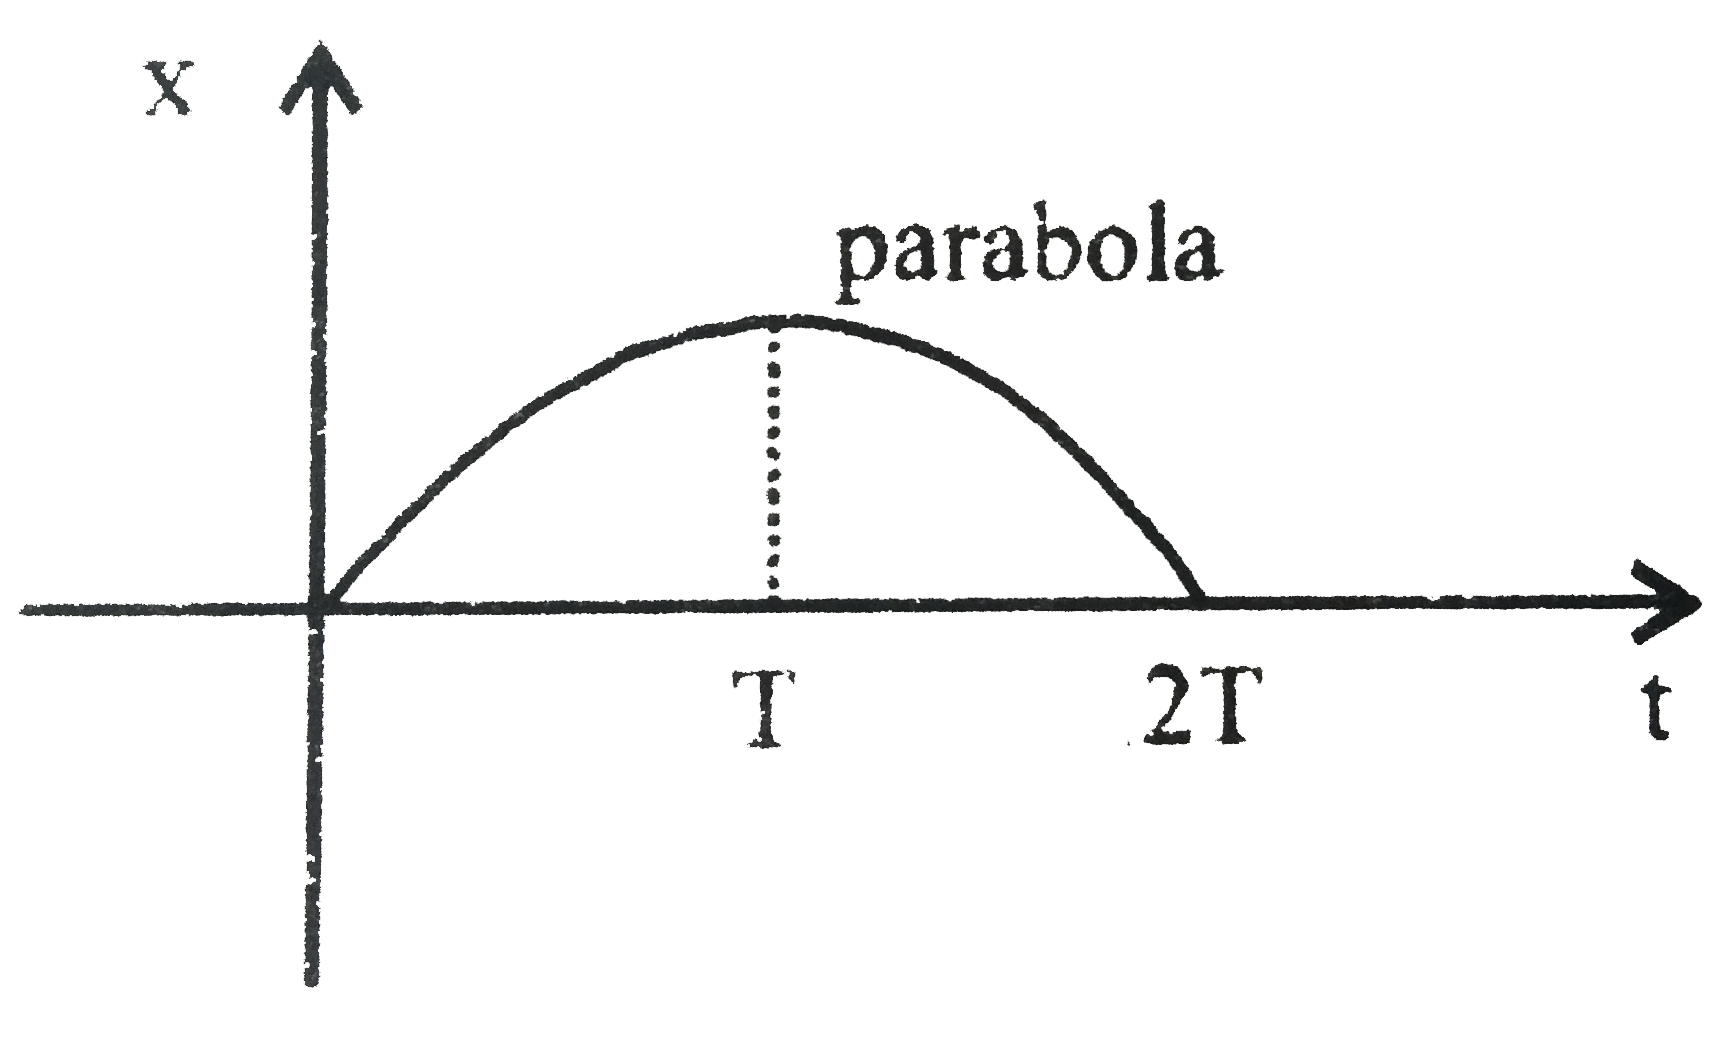
- The x-t graph of particle moving along a straight line is shown in fi...
Text Solution
|
- The x-t graph of a particle moving along a straight line is shown in f...
Text Solution
|
- The x-t graph of a particle moving along a straight line is shown in f...
Text Solution
|
- The x-t graph of a particle moving along a straight line is shown in f...
Text Solution
|
- The x-t graph of particle moving along a straight line is shown in fig...
Text Solution
|
- The x-t graph of particle moving along a straight line is shown in fig...
Text Solution
|
- The x-t graph of particle moving along a straight line is shown in fi...
Text Solution
|
- For a particle moving in a straight line, the position-time graph is a...
Text Solution
|
- The velocity -time (v - t) graph of a particle moving in a straight li...
Text Solution
|