Home
Class 11
PHYSICS
The x-t graph of particle moving along ...

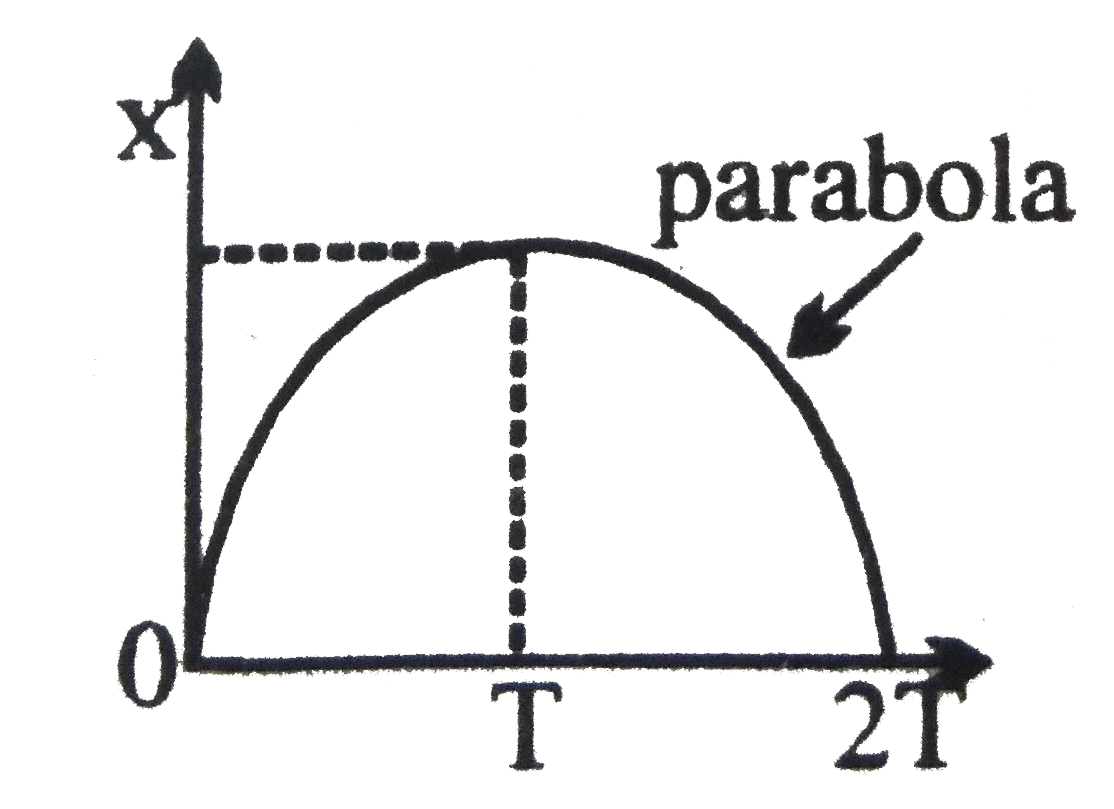
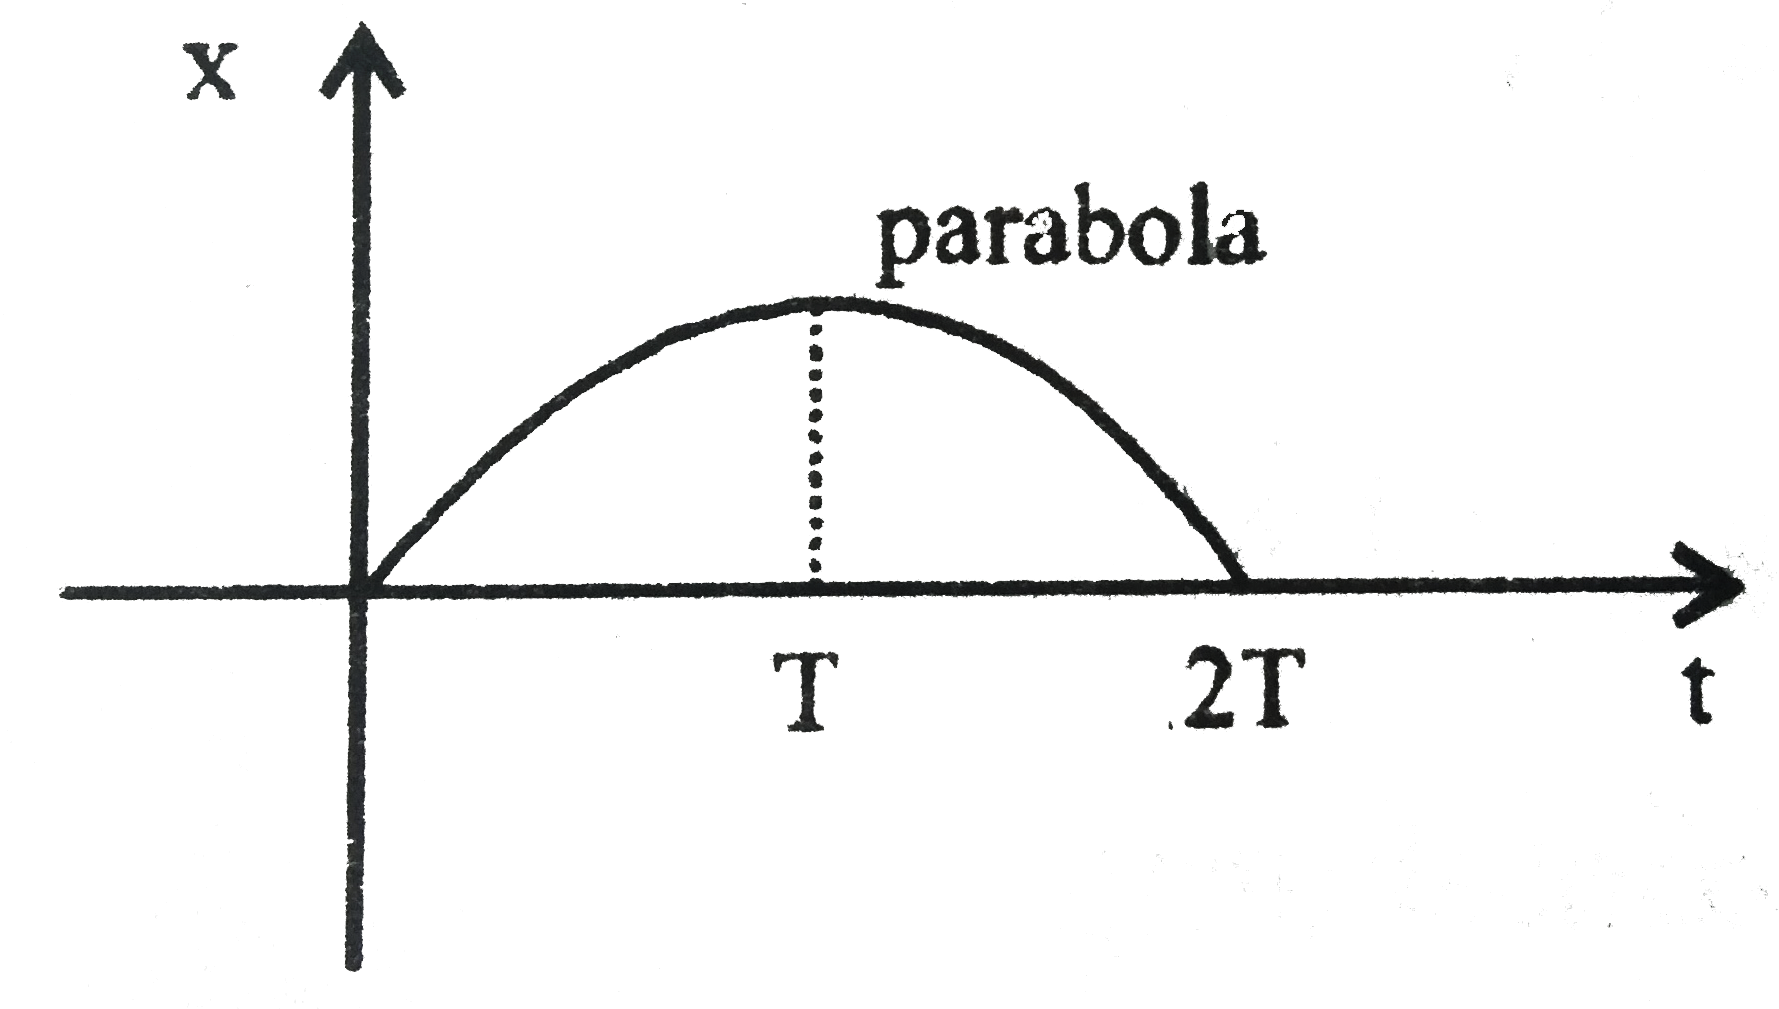
The `x-t` graph of particle moving along a straight line is shown in figure

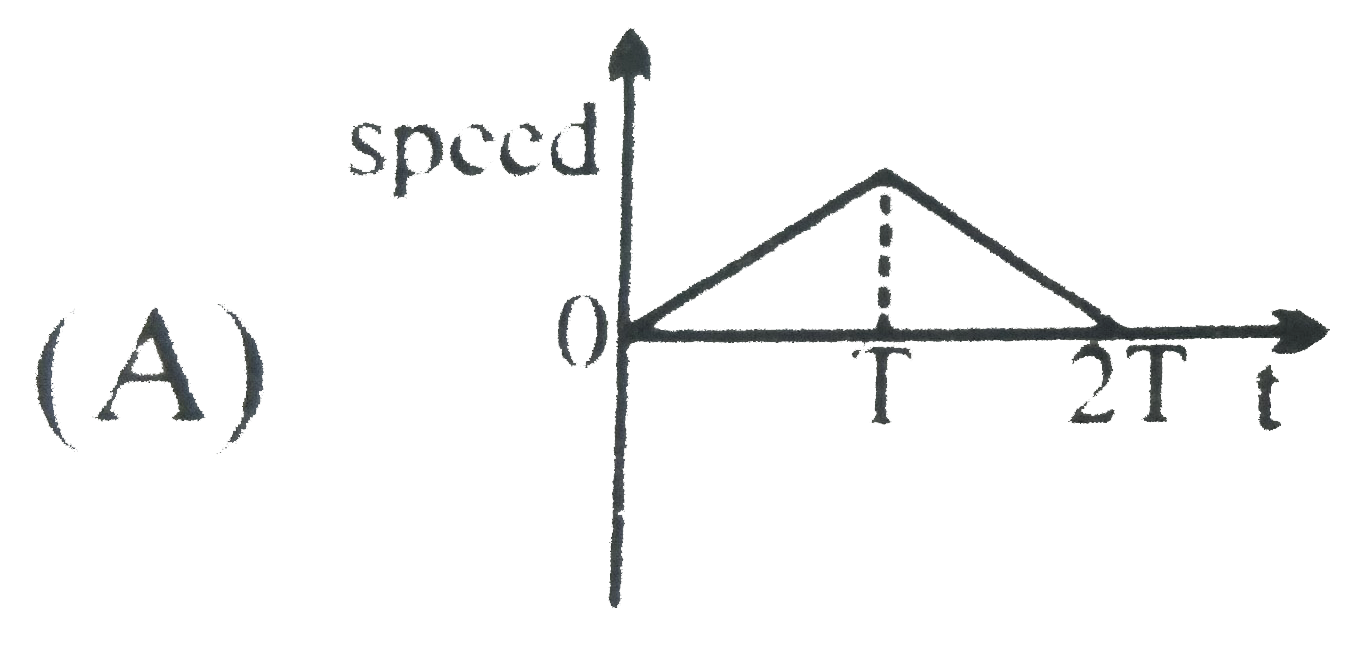
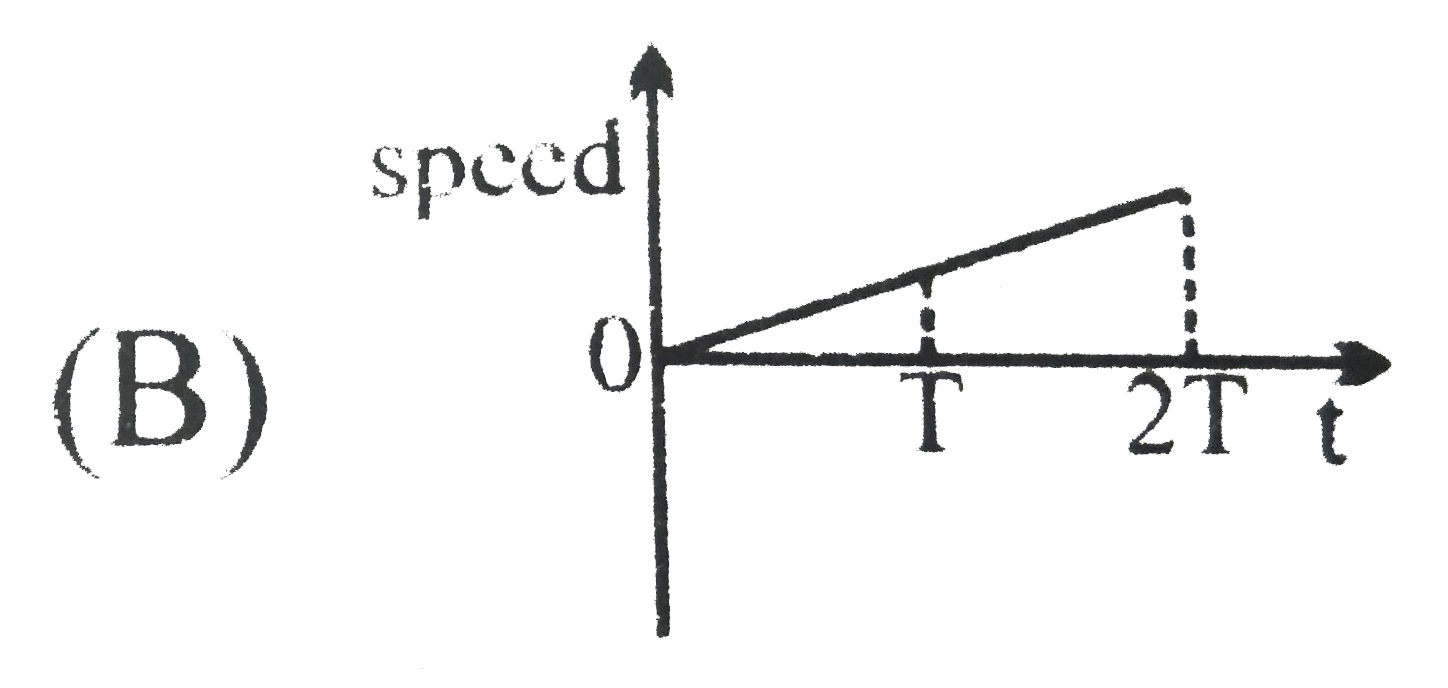
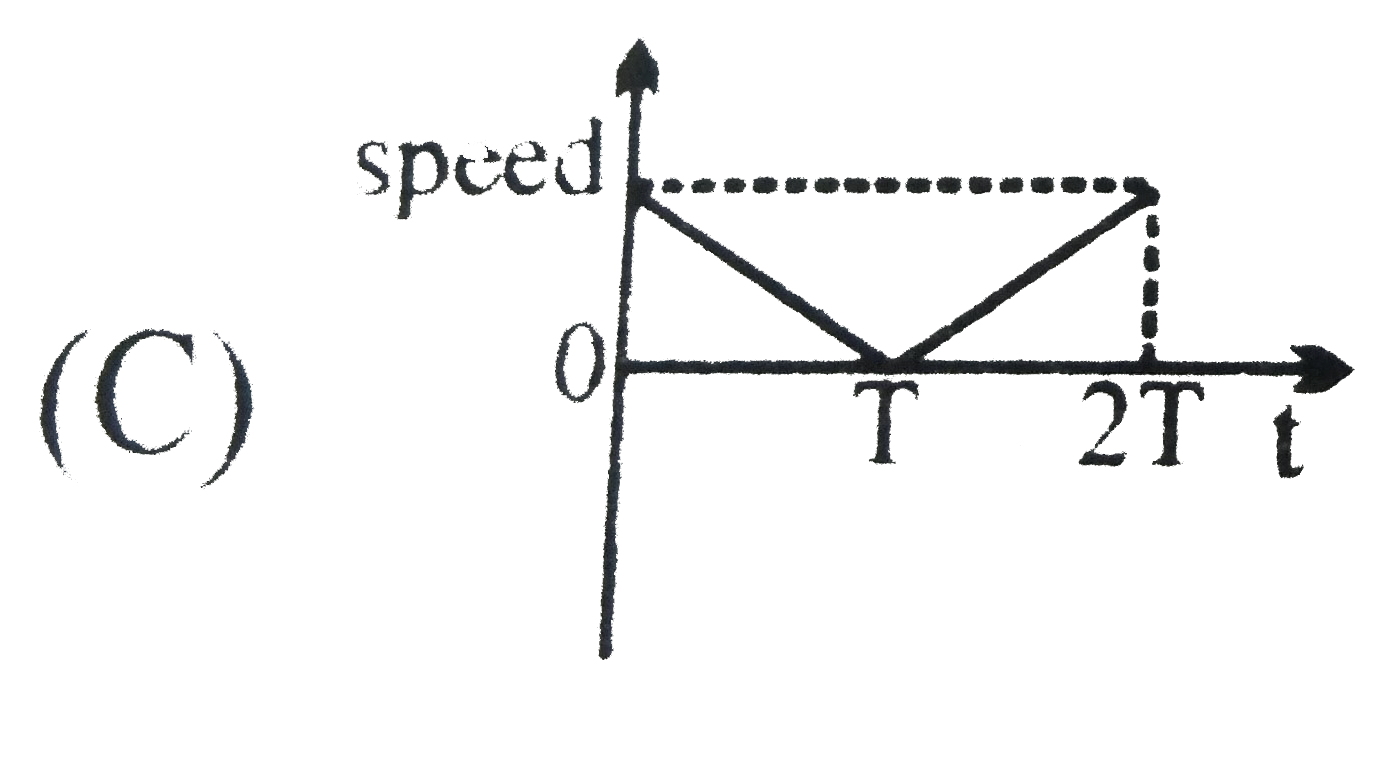
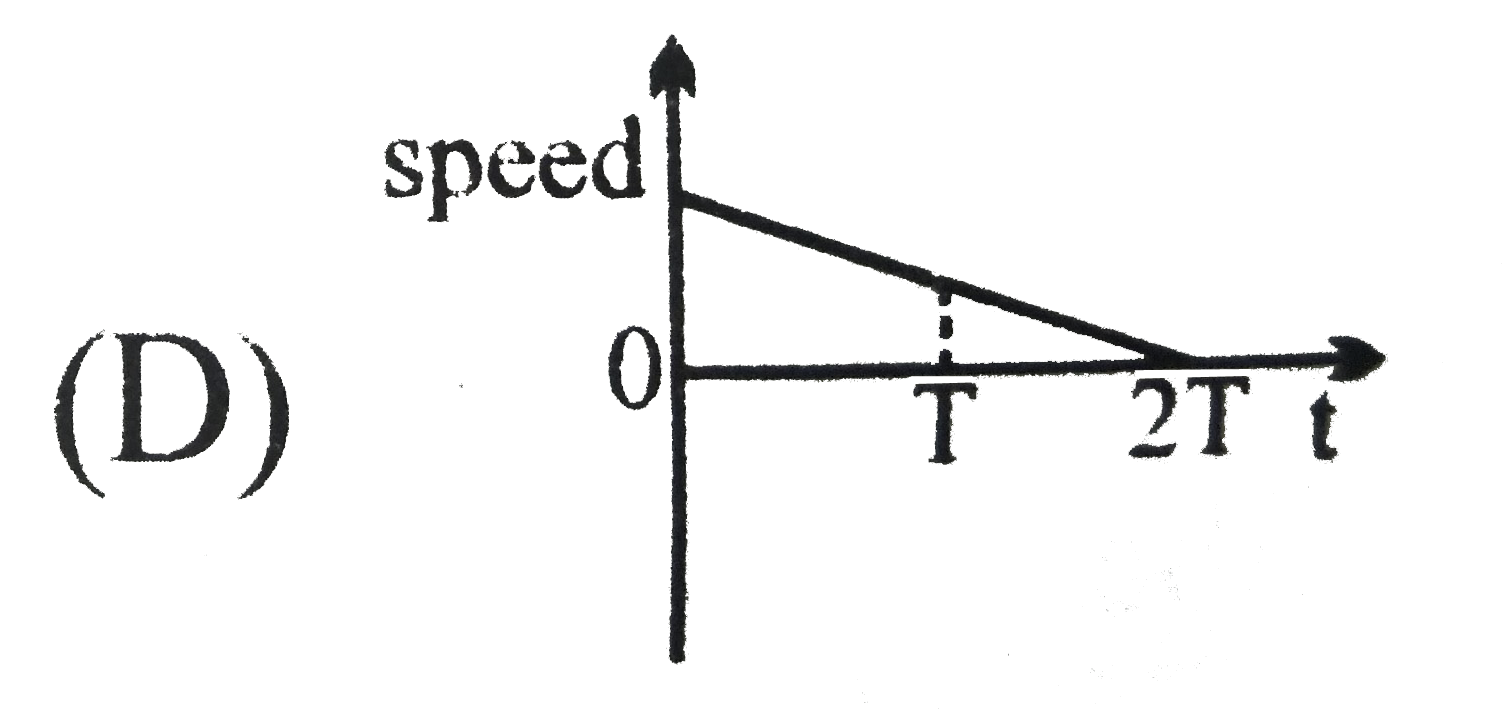
The speed-time graph of the particle si correctly shown by

A

B

C

D

Text Solution

Verified by Experts

The correct Answer is:
C

The `x-t` graph of a aprticle moving along a stright line is hown in fig.
Doubtnut Promotions Banner Mobile Dark
|

Similar Questions

Explore conceptually related problems

The velocity-time graph of a particle moving along a straight line is shown in the figure-given below The displacement of the particle in 5 second is

The x-t graph of particle moving along a straight line is shown in figure The a-t graph of the particle is correctly shown by

Knowledge Check

  • The x-t graph of a particle moving along a straight line is shown in figure The speed-time graph of the particle is correctly shown by

    A
    B
    C
    D
  • The x-t graph of a particle moving along a straight line is shown in figure The v-t graph of the particle is correctly shown by

    A
    B
    C
    D
  • The x-t graph of a particle moving along a straight line is shown in figure The a-t graph of the particle is correctly shown by

    A
    B
    C
    D
  • Similar Questions

    Explore conceptually related problems

    The x-t graph of particle moving along a straight line is shown in figure The v-t graph of the particles is correctly shown by

    Displacement time graph of a particle moving in a straight line is a shown in figure.

    The velocity - time graph of a particle moving along a straight line is shown in the figure given below The displacement of the particle in 5 second is

    The kinetic energy (KE) versus time graph for a particle moving along a straight line is as shown in the figure. The force versus time graph for the particle may be

    The velocity -time (v - t) graph of a particle moving in a straight line is shown in figure. The acceleration of the particle at t = 9 is: