Text Solution
Verified by Experts
The correct Answer is:


Similar Questions
Explore conceptually related problems
Recommended Questions
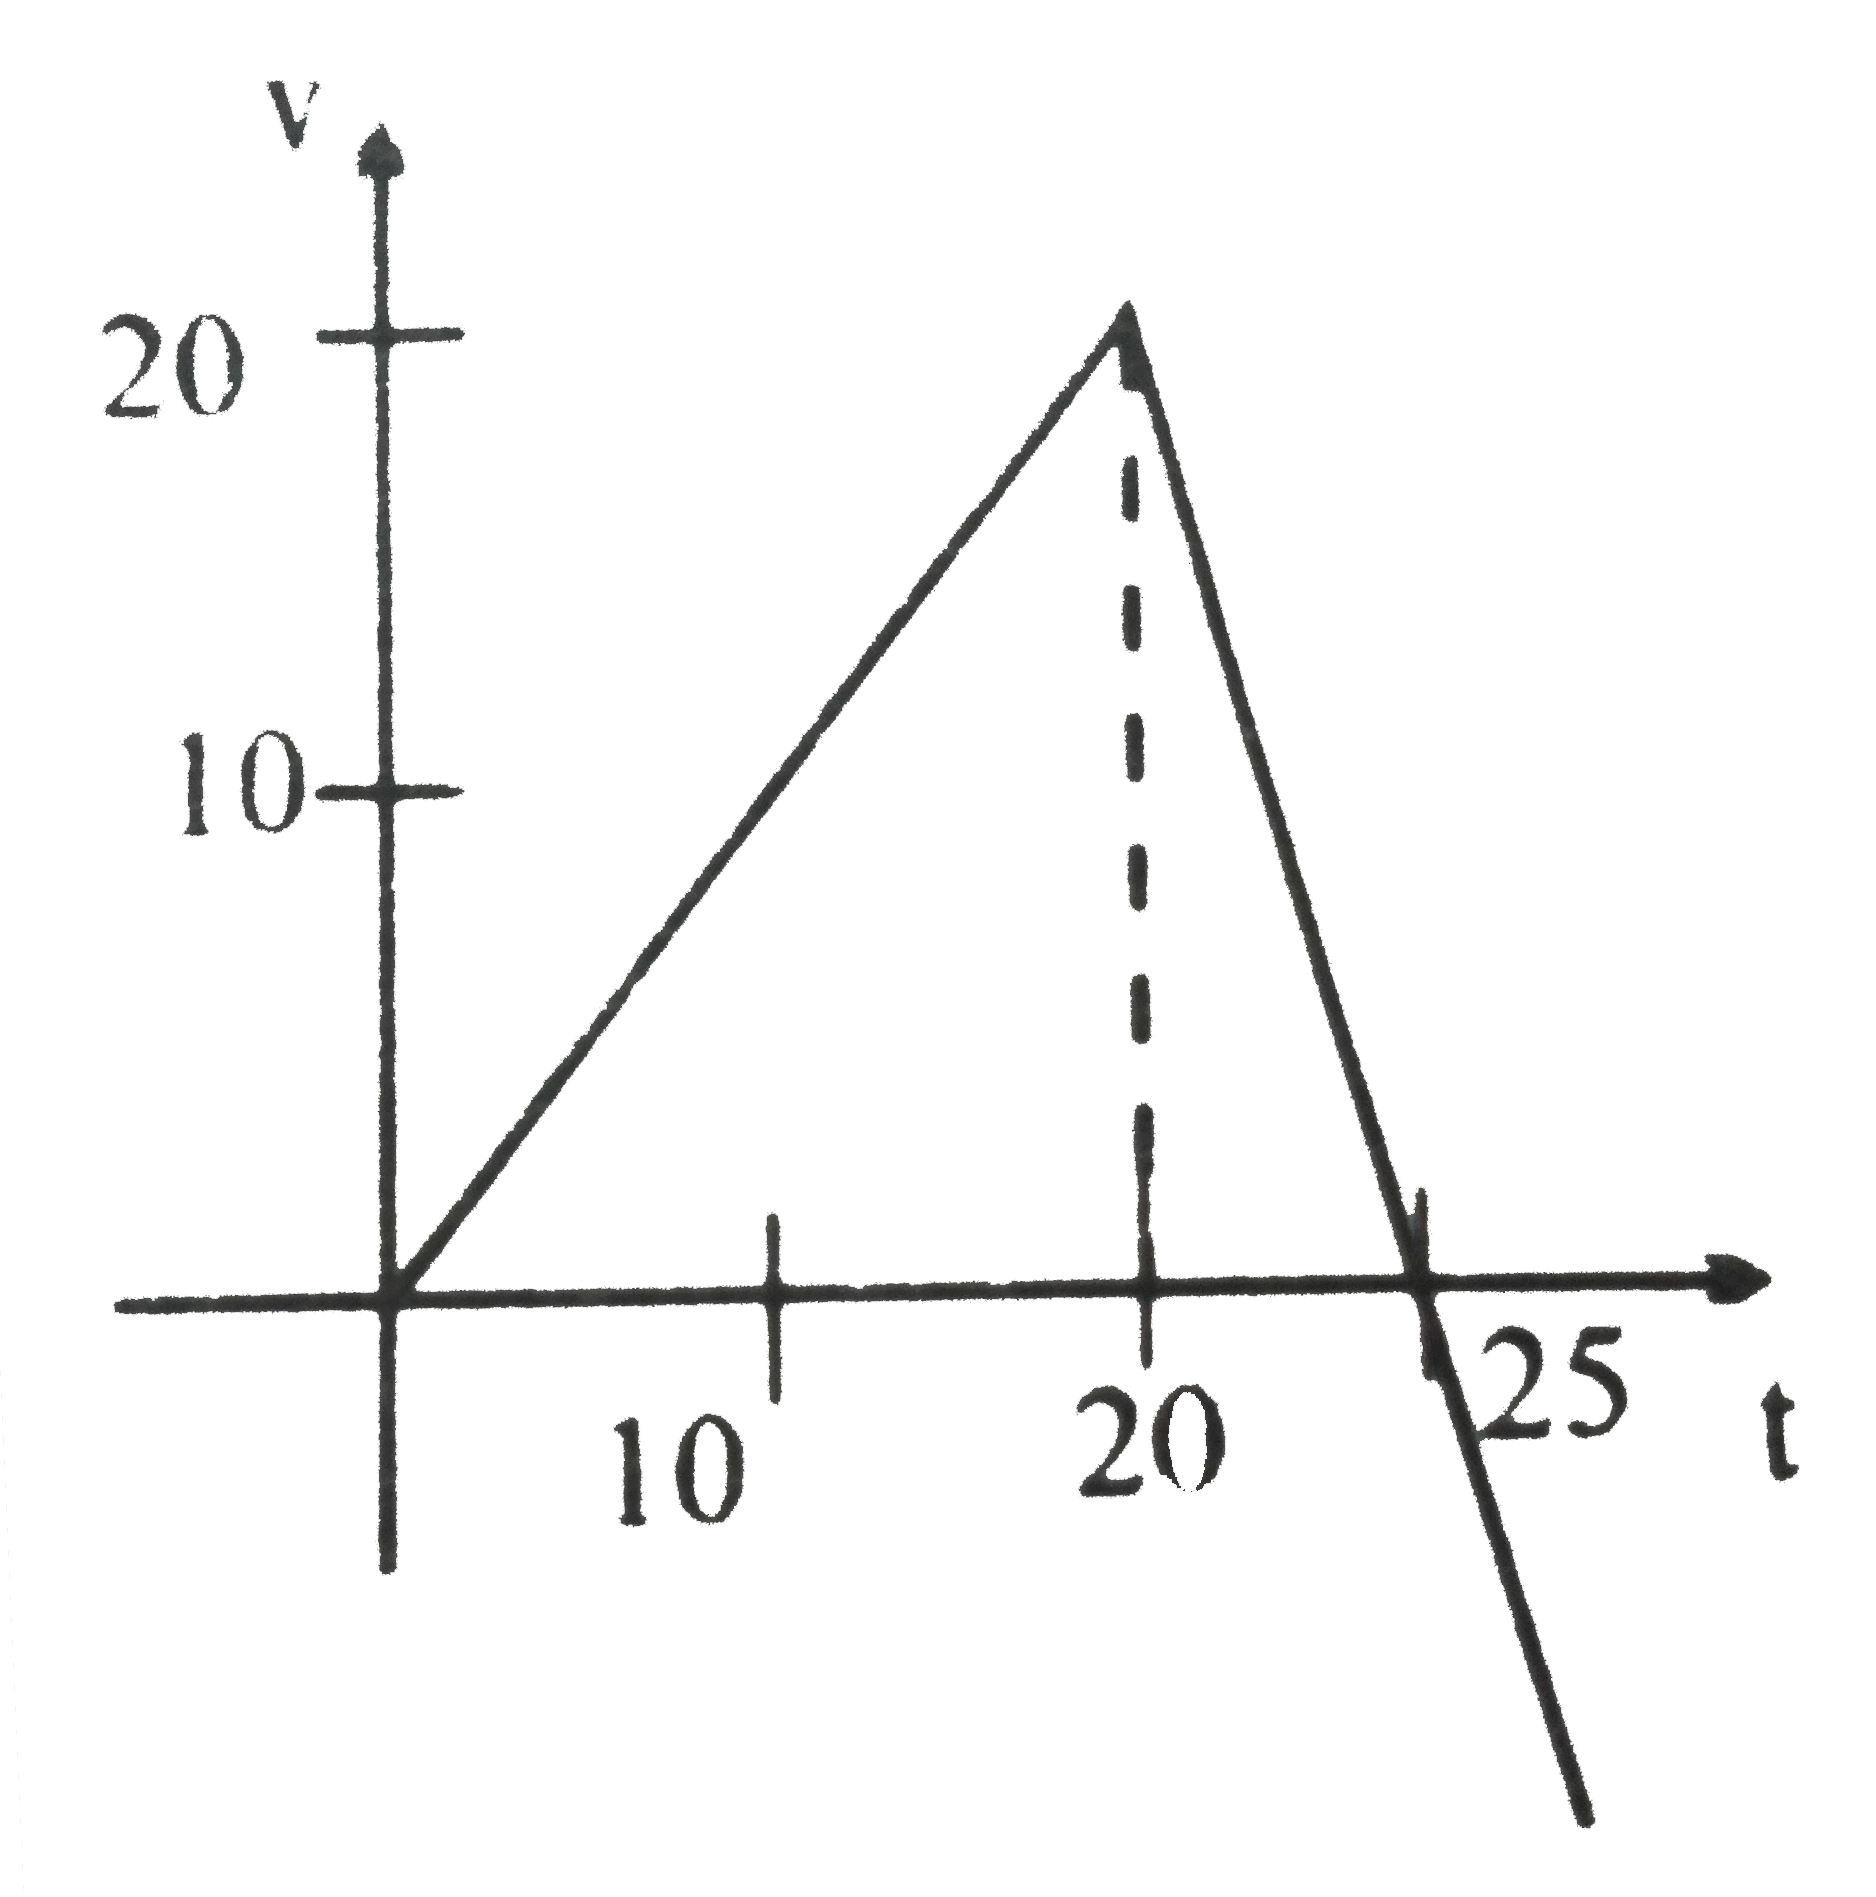
- The fig. shows the v-t graph of a particle moving in straight line. Fi...
Text Solution
|
- Figure shows the displacement-time graph of a particle moving in a str...
Text Solution
|
- The acceleration versus time graph of a particle moving in a straight ...
Text Solution
|
- The x-t graph of a particle moving along a straight line is shown in f...
Text Solution
|
- The x-t graph of particle moving along a straight line is shown in fig...
Text Solution
|
- For a particle moving in a straight line, the position-time graph is a...
Text Solution
|
- The velocity -time (v - t) graph of a particle moving in a straight li...
Text Solution
|
- सरल रेखा में गति करते हुए एक कण का त्वरण समय ग्राफ चित्र में प्रदर्शित...
Text Solution
|
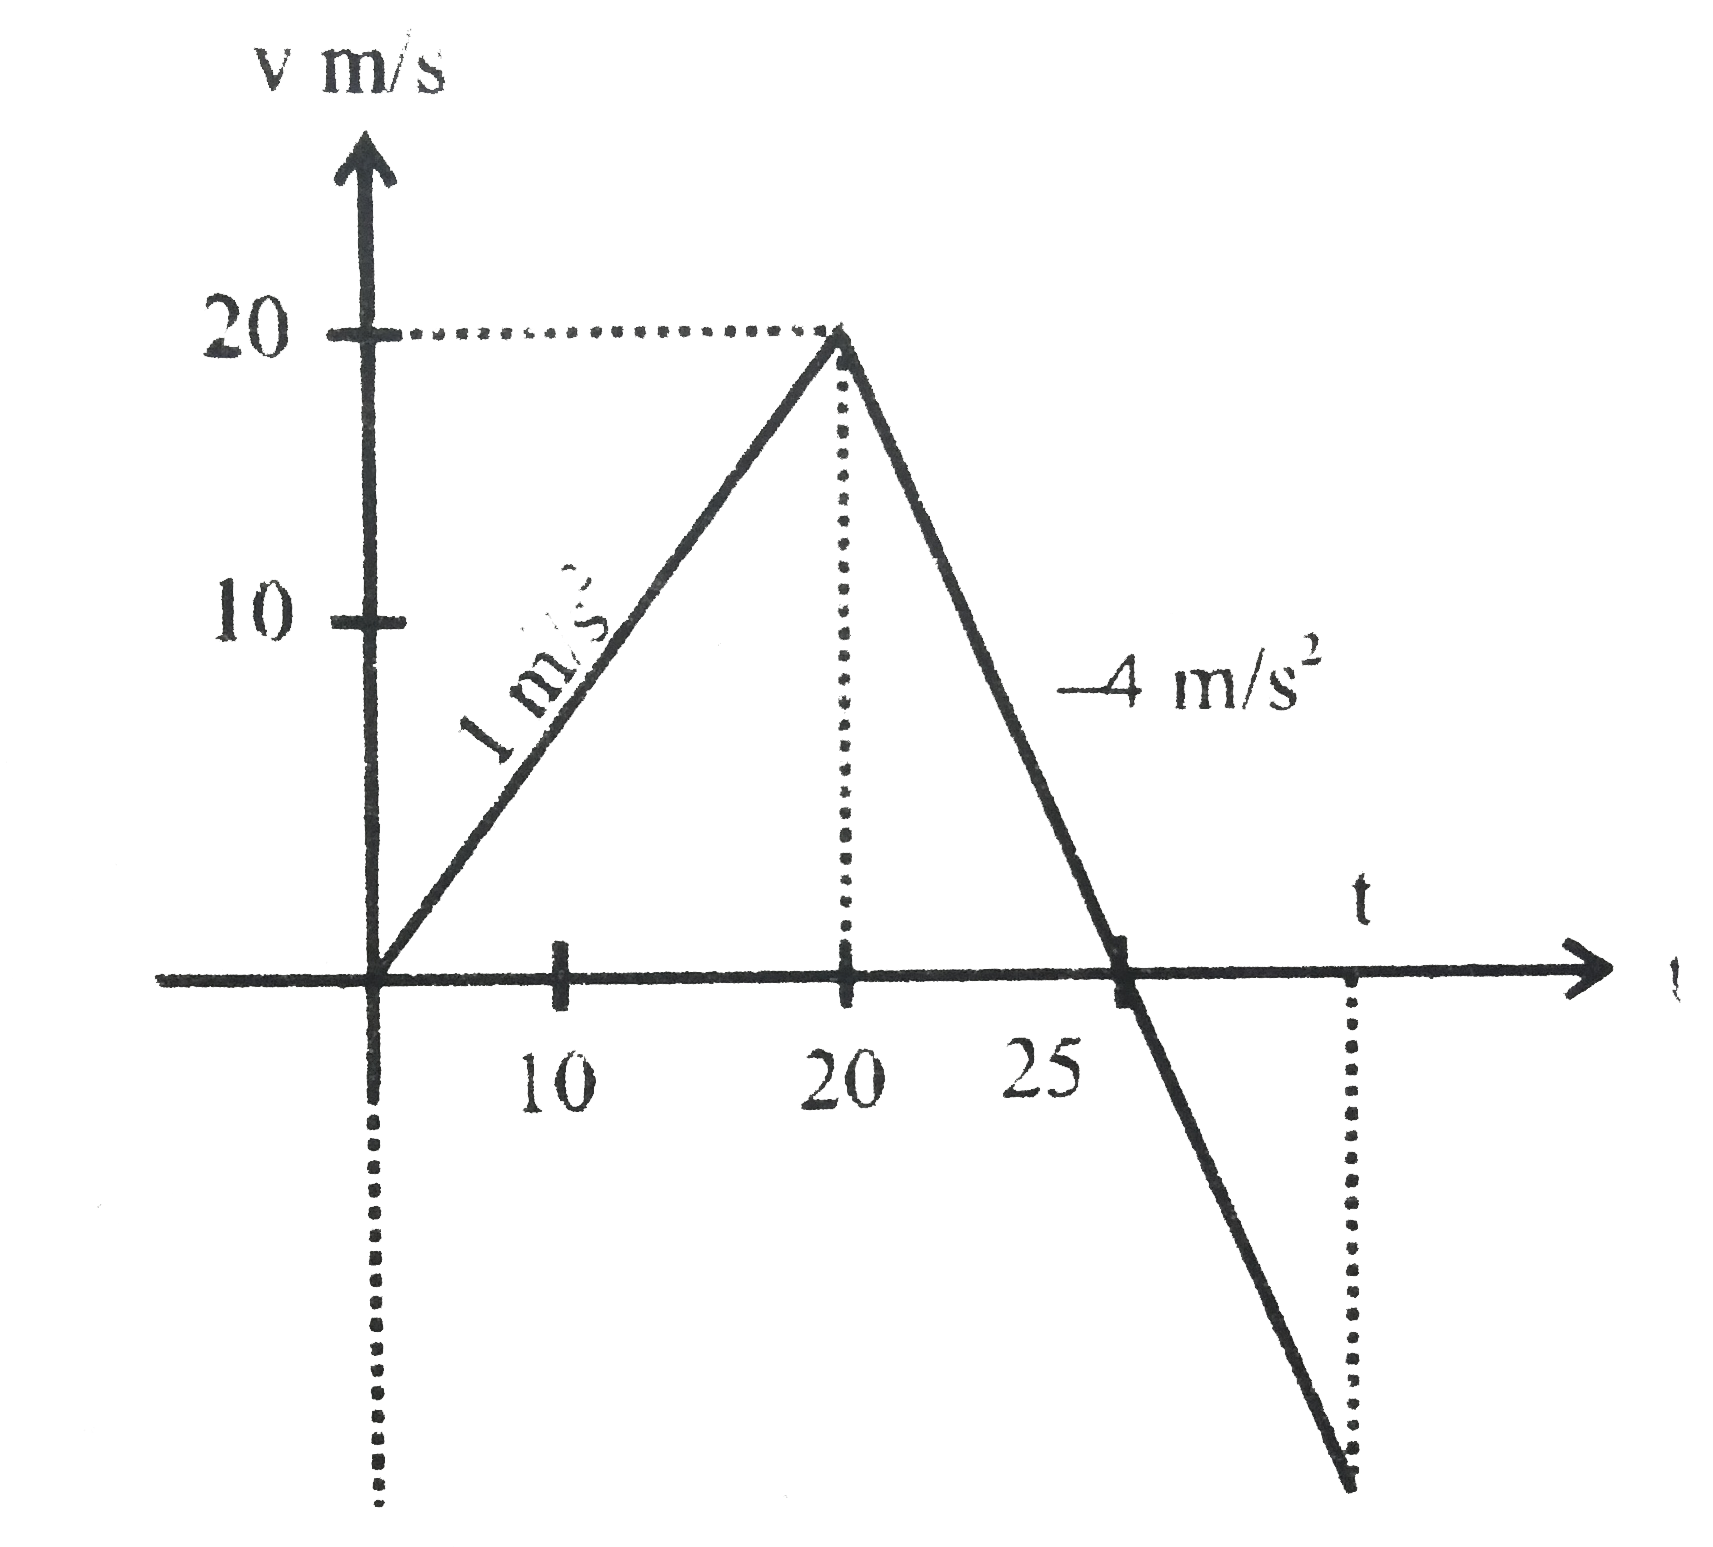
- The figure shows the v - t graph of a particle moving in a straight li...
Text Solution
|