 ,
, 
A
B
C
D
Text Solution
Verified by Experts
The correct Answer is:


Similar Questions
Explore conceptually related problems
Recommended Questions
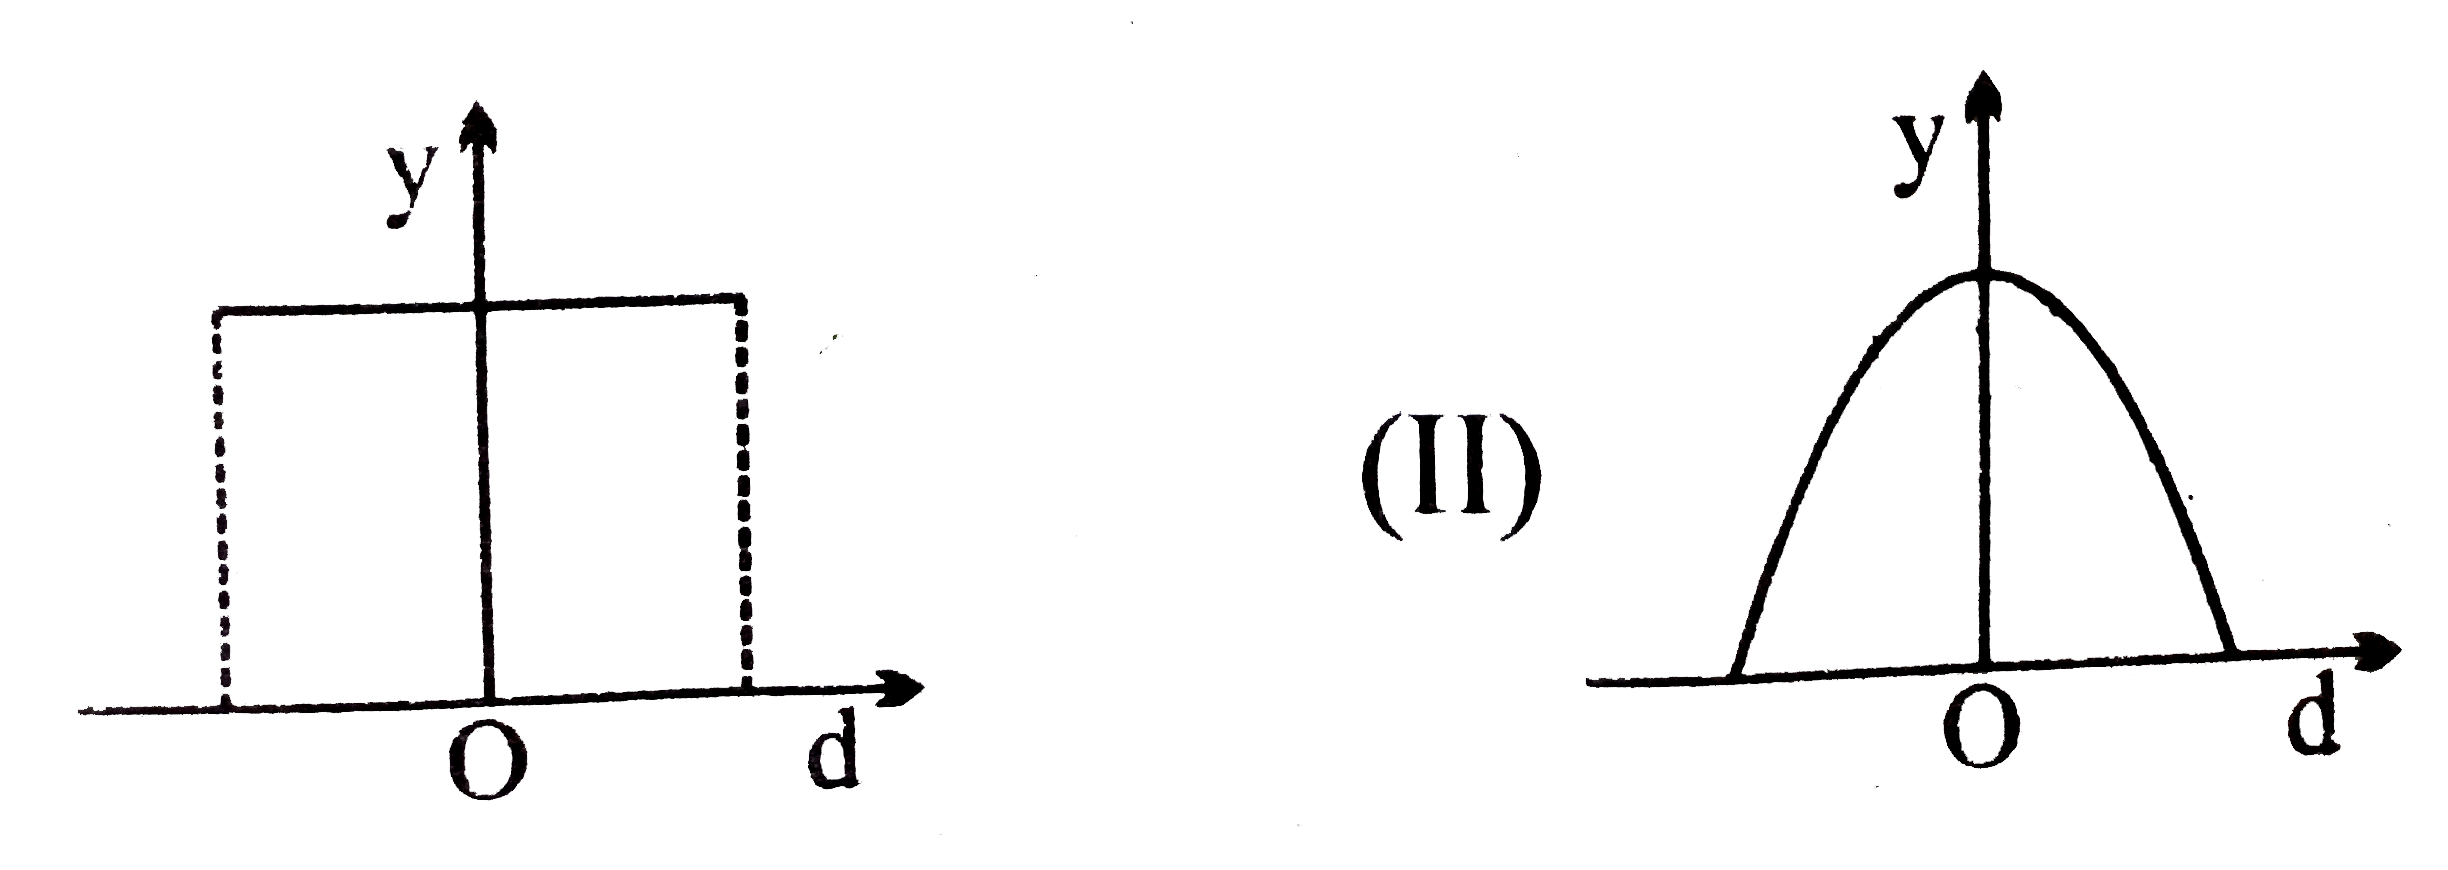
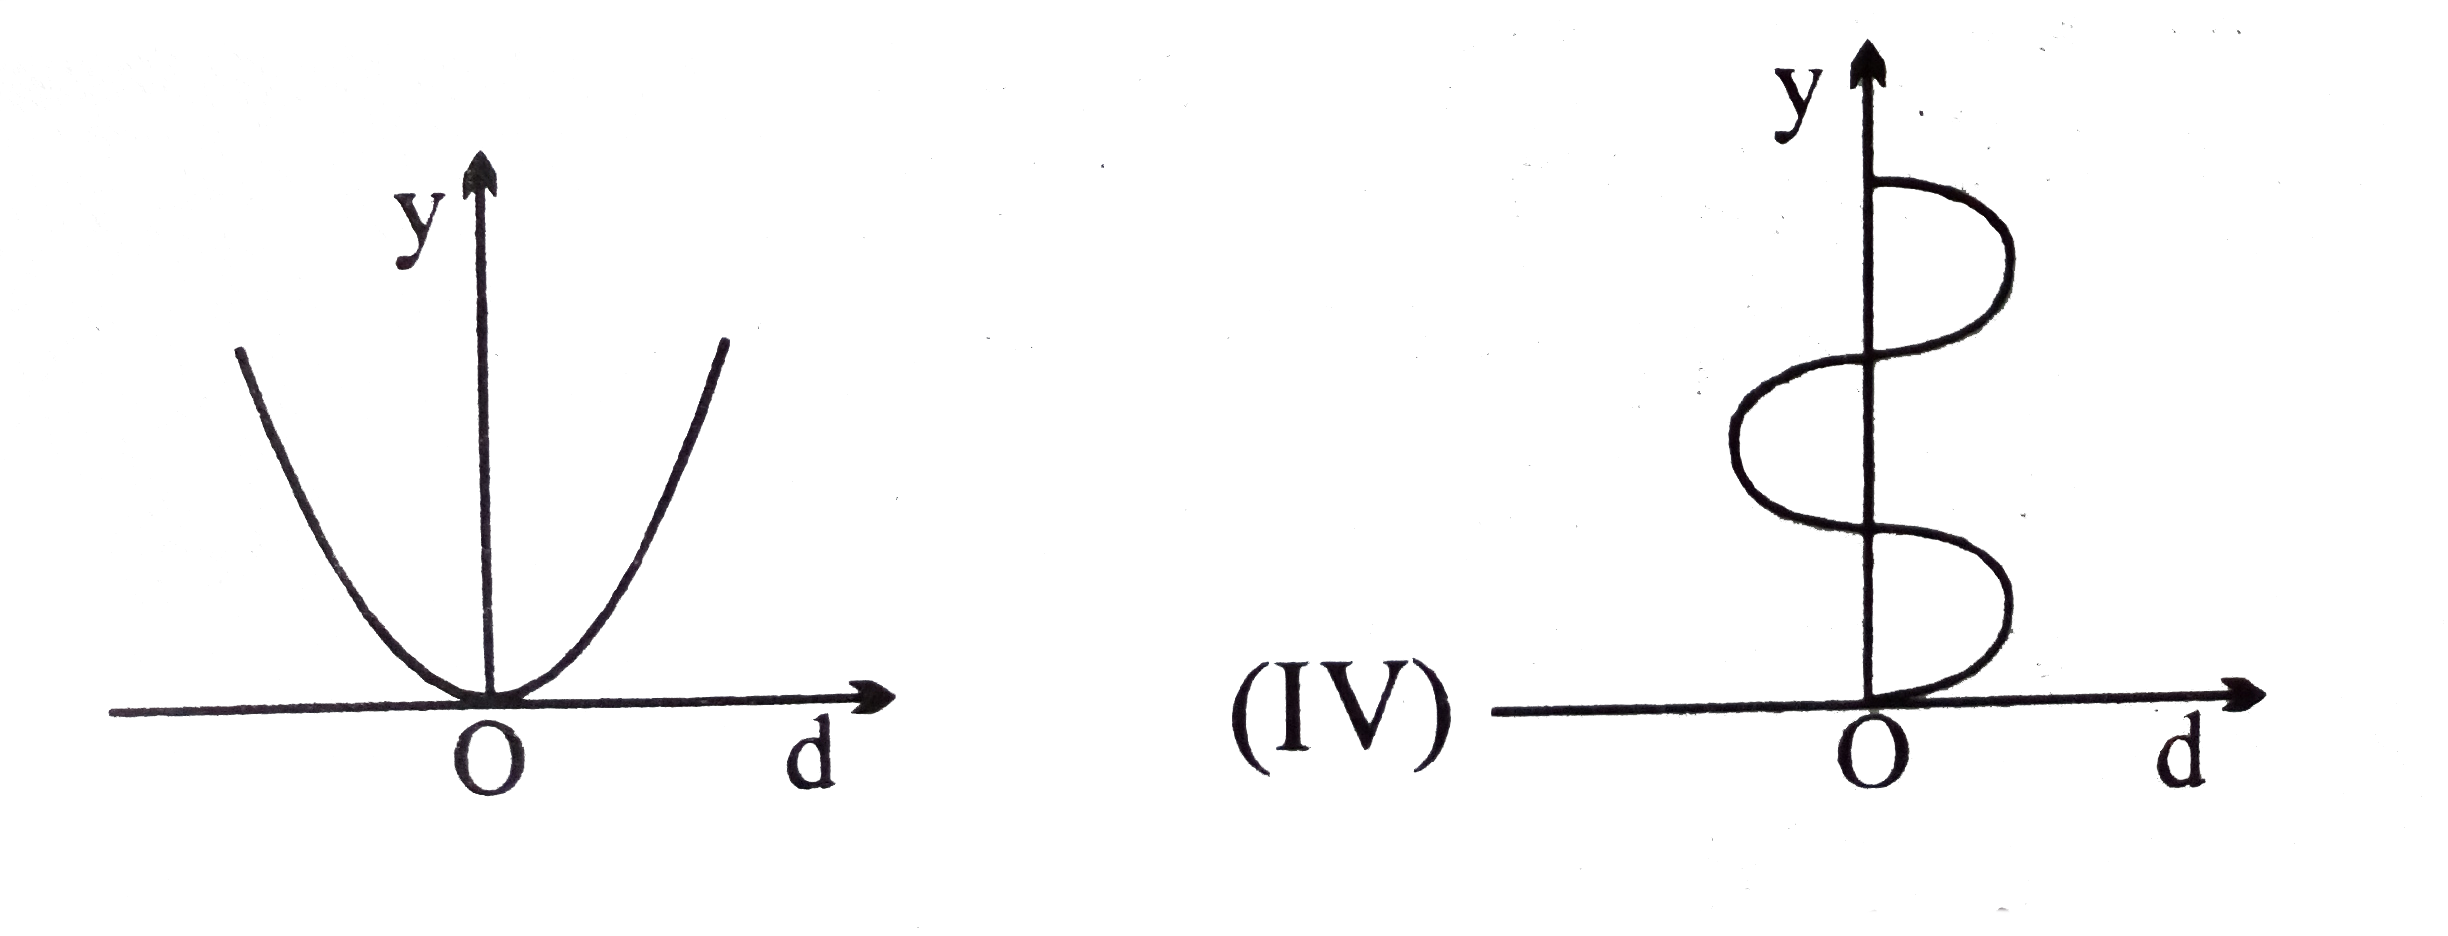
- The graphs in fugure show that a quantity Y varies with displacement d...
Text Solution
|
- Figure shows the position the graph for a particle in one dimensional ...
Text Solution
|
- The acceleration displacement graph of a particle executing simple har...
Text Solution
|
- The graphs in fugure show that a quantity Y varies with displacement d...
Text Solution
|
- The graphs in fugure show that a quantity Y varies with displacement d...
Text Solution
|
- The graphs in fugure show that a quantity Y varies with displacement d...
Text Solution
|
- Part of a simple harmonic motion is graphed in the figure, where y is ...
Text Solution
|
- Draw a graph to show the variation of PE, KE and total energy of a sim...
Text Solution
|
- The same progressive wave is represented by two graphs I and II . Grap...
Text Solution
|