 ,
, 
A
B
C
D
Text Solution
Verified by Experts
The correct Answer is:


Similar Questions
Explore conceptually related problems
Recommended Questions
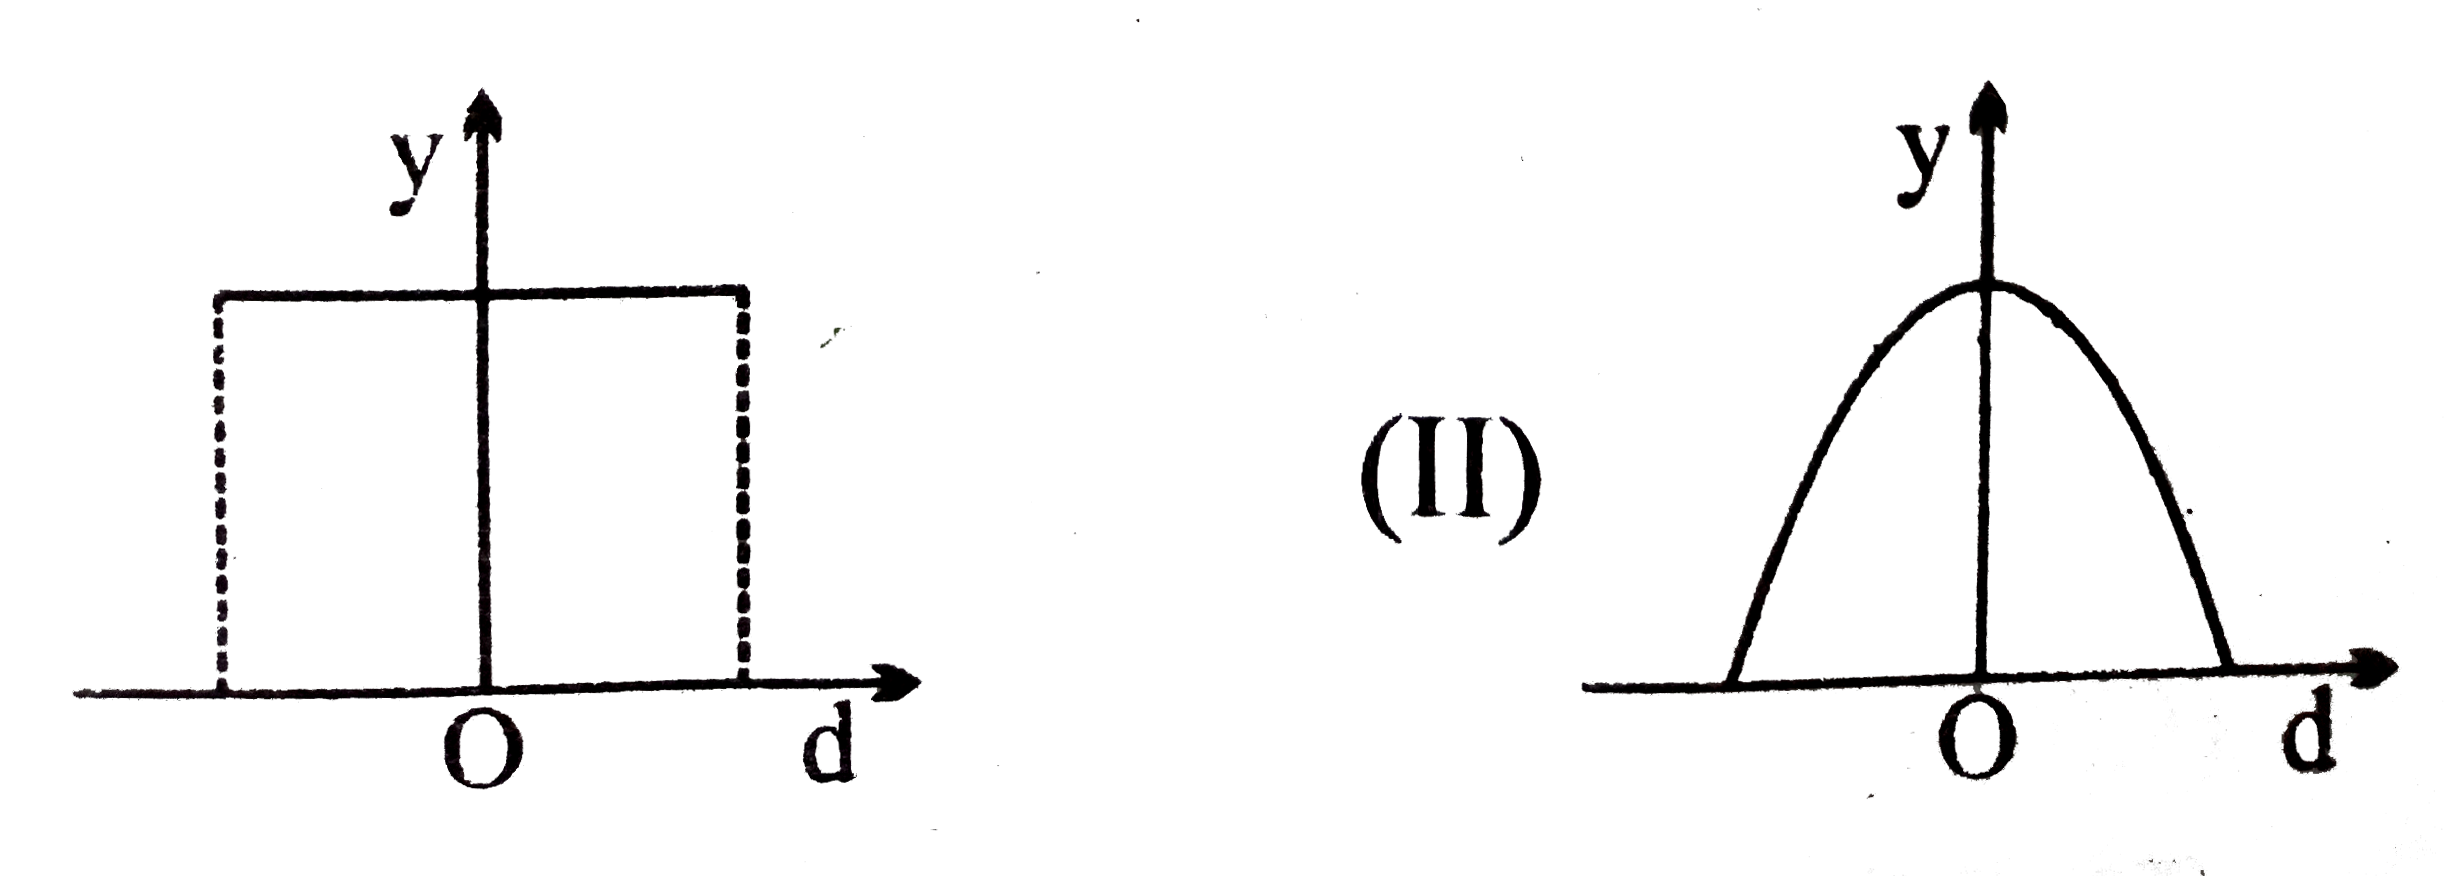
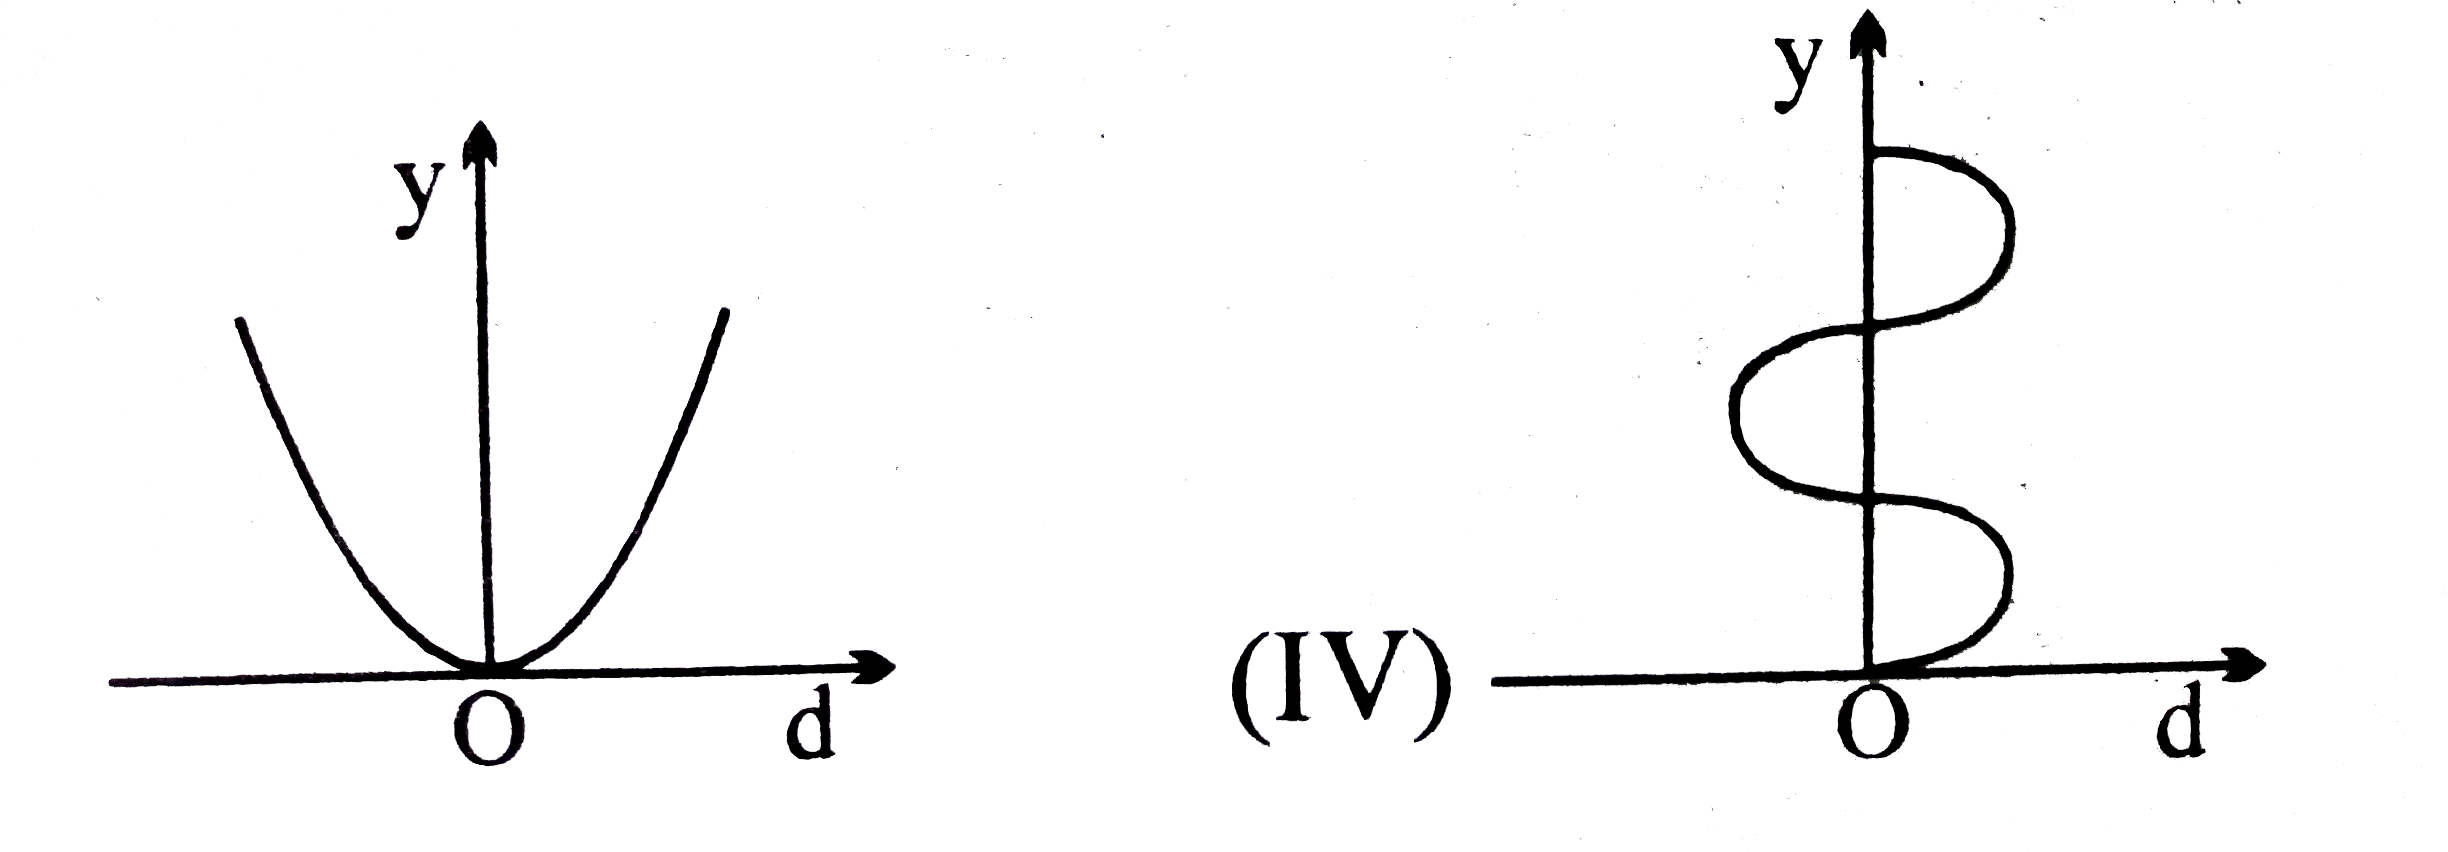
- The graphs in fugure show that a quantity Y varies with displacement d...
Text Solution
|
- For a particle undergoing simple harmonic motion, the velocity is plot...
Text Solution
|
- Figure shows the position the graph for a particle in one dimensional ...
Text Solution
|
- The acceleration displacement graph of a particle executing simple har...
Text Solution
|
- The graphs in fugure show that a quantity Y varies with displacement d...
Text Solution
|
- The graphs in fugure show that a quantity Y varies with displacement d...
Text Solution
|
- The graphs in fugure show that a quantity Y varies with displacement d...
Text Solution
|
- The figure shows graph between velocity 'V' and displacement 'X' from ...
Text Solution
|
- A particle executes simple harmonic motion. Then the graph of veloctiy...
Text Solution
|