 ,
, 
A
B
C
D
Text Solution
Verified by Experts
The correct Answer is:


Similar Questions
Explore conceptually related problems
Recommended Questions
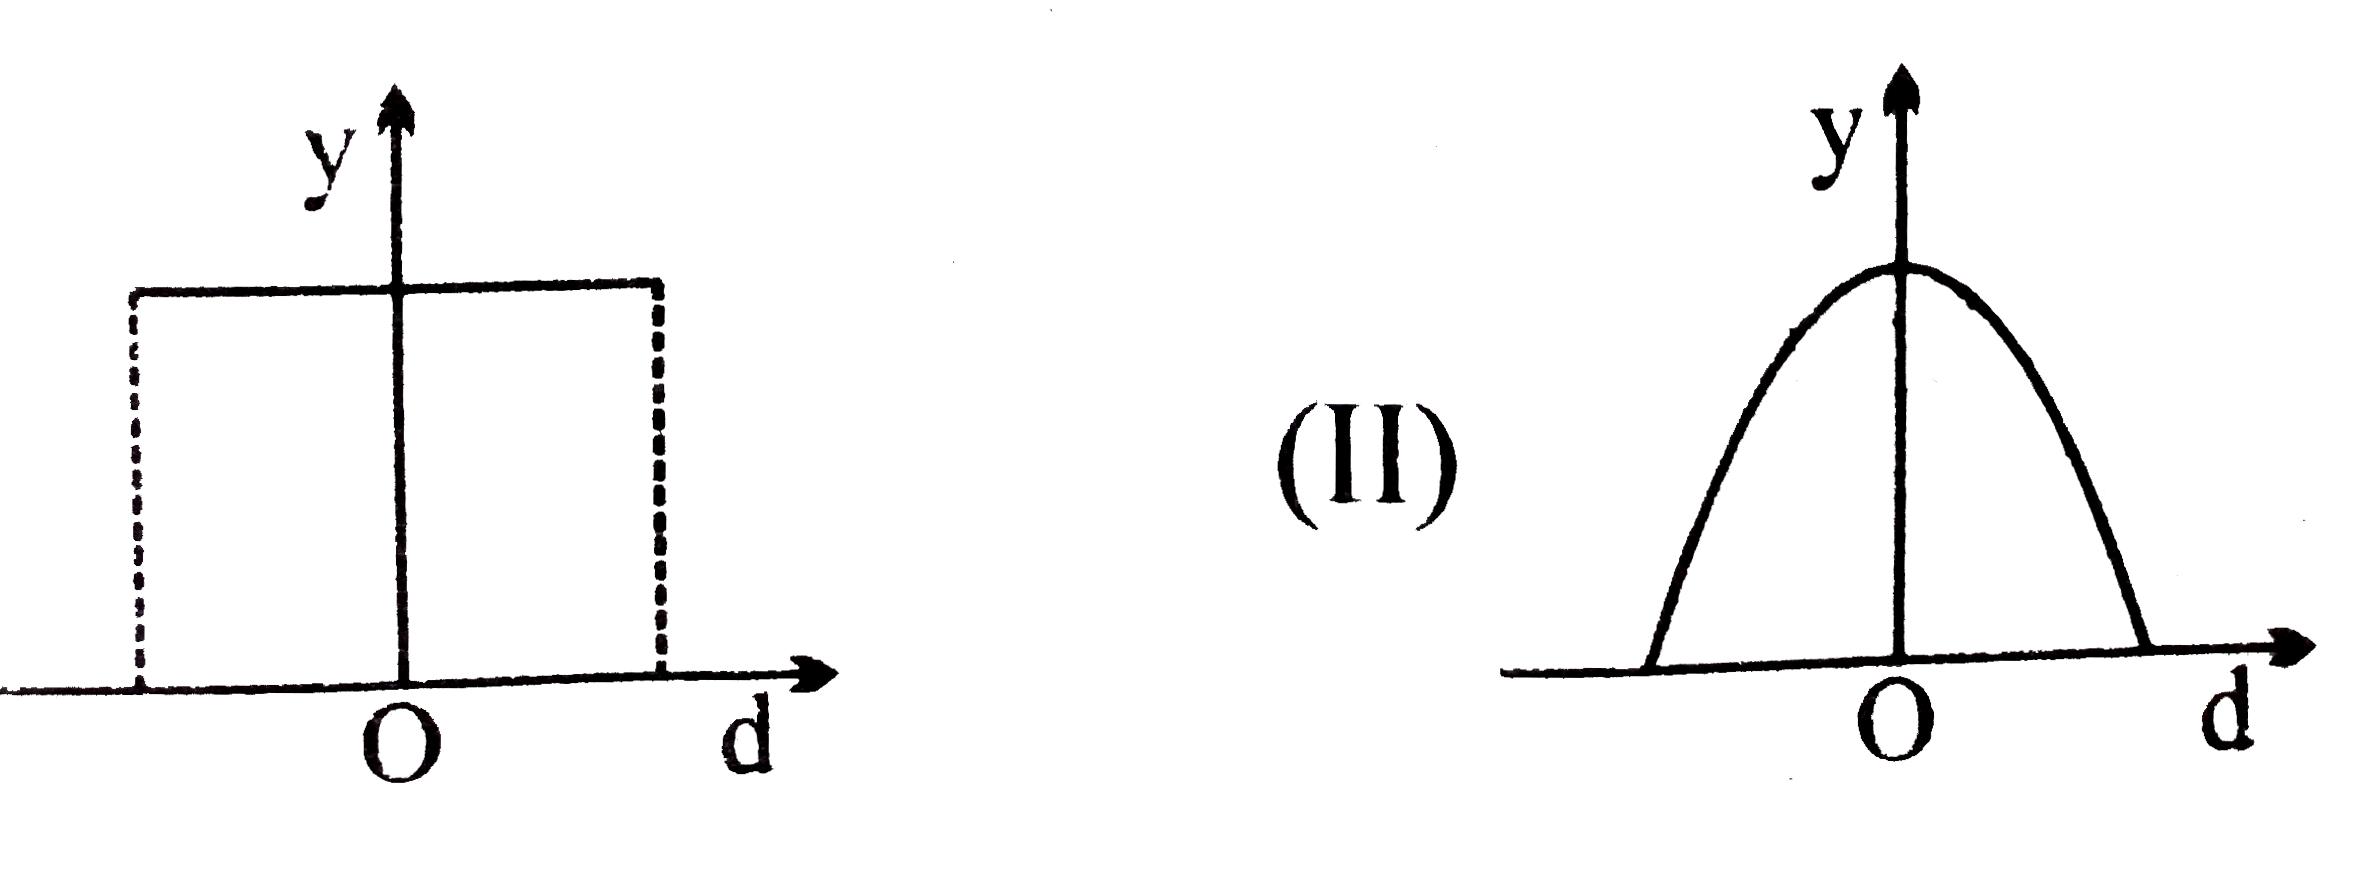
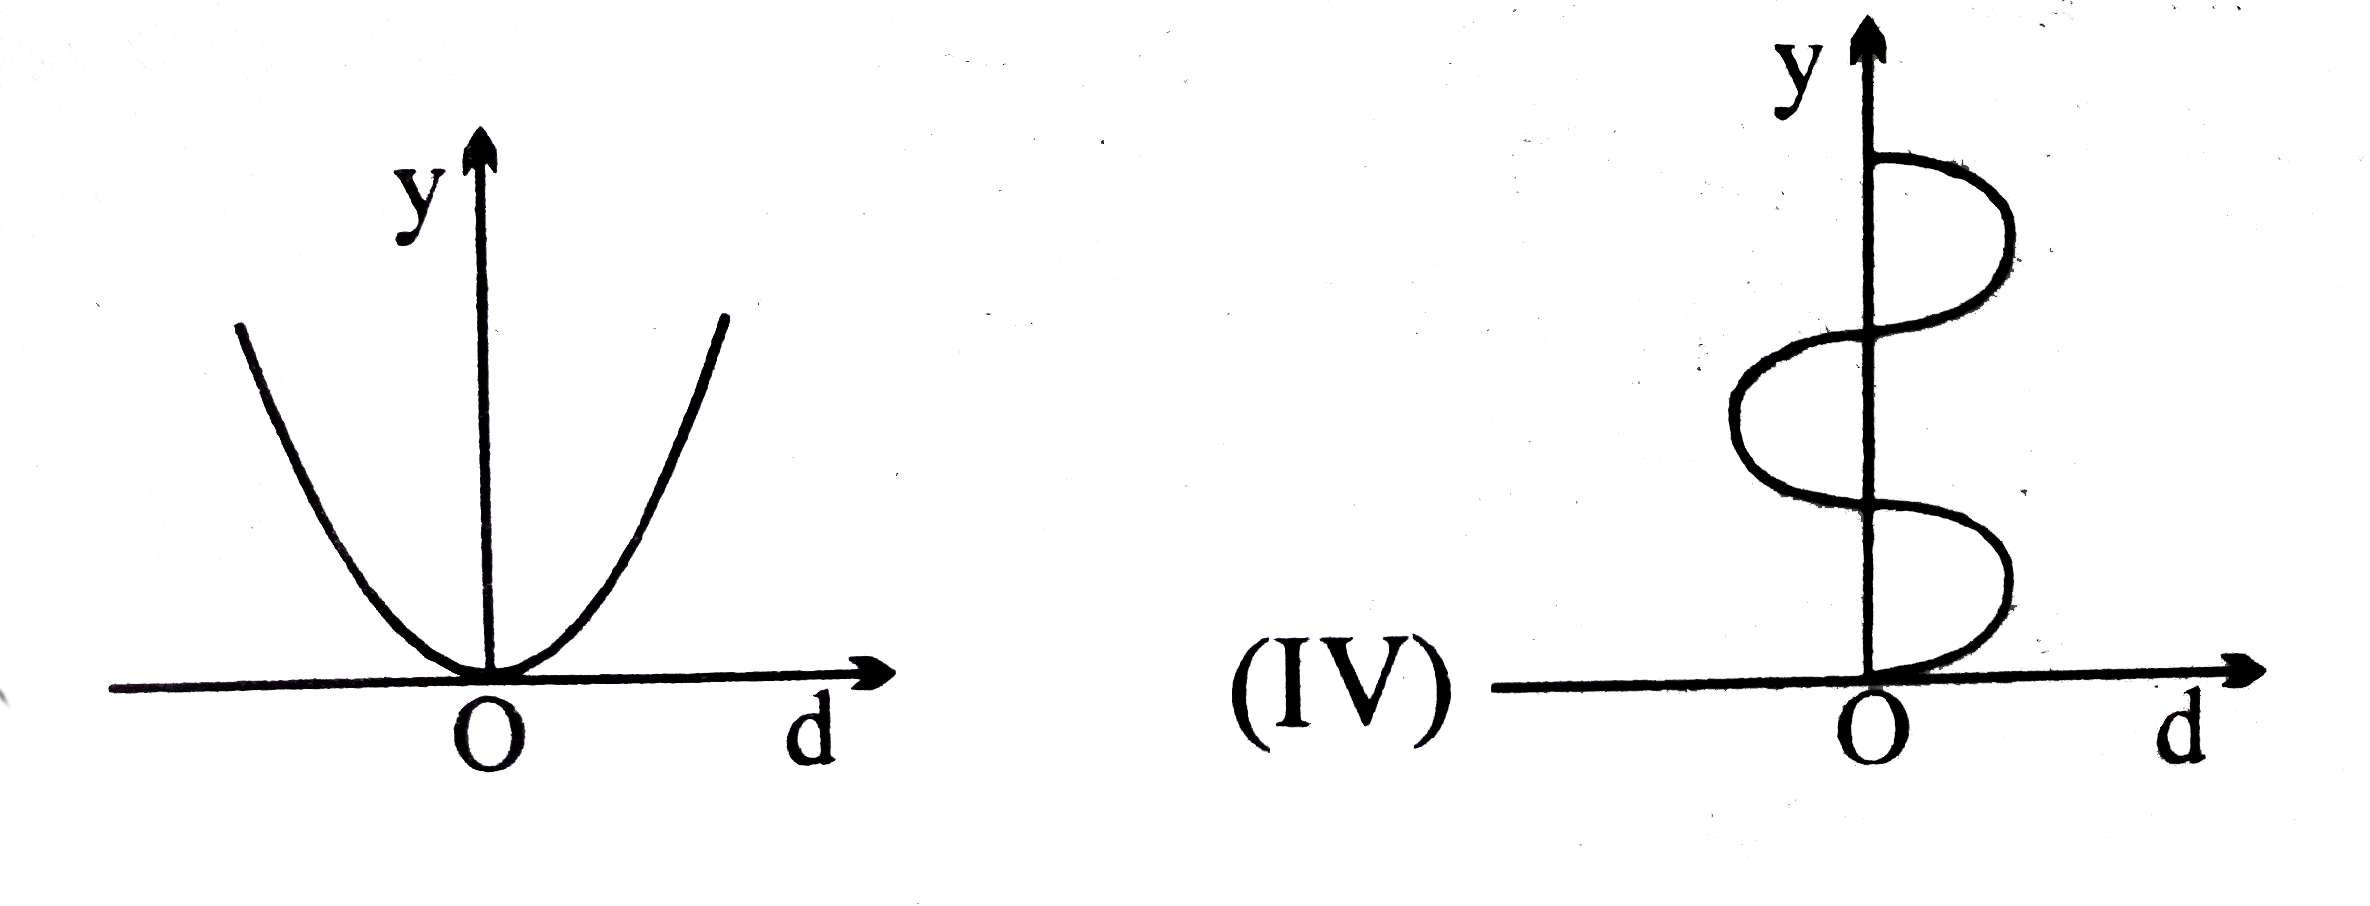
- The graphs in fugure show that a quantity Y varies with displacement d...
Text Solution
|
- For a particle undergoing simple harmonic motion, the velocity is plot...
Text Solution
|
- The acceleration displacement graph of a particle executing simple har...
Text Solution
|
- The graphs in fugure show that a quantity Y varies with displacement d...
Text Solution
|
- The graphs in fugure show that a quantity Y varies with displacement d...
Text Solution
|
- The graphs in fugure show that a quantity Y varies with displacement d...
Text Solution
|
- A particle executes simple harmonic motion. Then the graph of veloctiy...
Text Solution
|
- Statement-I : In simple harmonic motion, the graph between velocity an...
Text Solution
|
- Assertion : Simple harmonic motion is an example on one dimensional mo...
Text Solution
|