A
B
C
D
Text Solution
Verified by Experts
The correct Answer is:


Similar Questions
Explore conceptually related problems
Recommended Questions
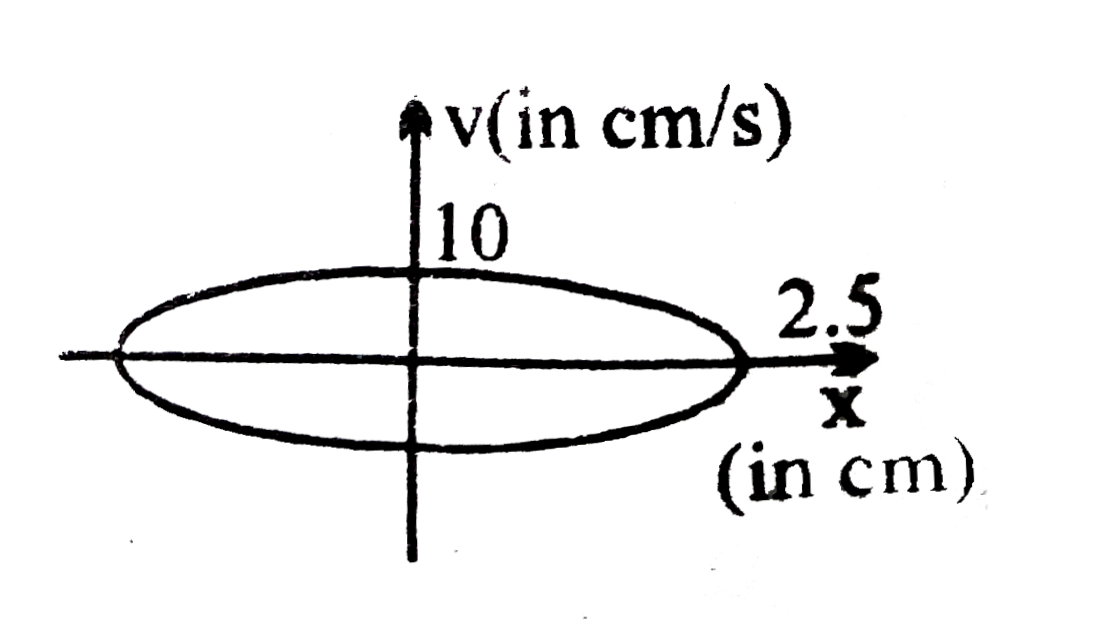
- The figure shows a graph between velocity and displacement (from mean ...
Text Solution
|
- Part of SHM is graphed in the figure. Here, y is displacement from mea...
Text Solution
|
- The figure shows a graph between velocity and displacement (from mean ...
Text Solution
|
- The figure shows graph between velocity 'V' and displacement 'X' from ...
Text Solution
|
- The figure shows graph between velocity 'V' and displacement 'X' from ...
Text Solution
|
- A particle performing SHM having amplitude 'a' possesses velocity ((3)...
Text Solution
|
- If a graph is plotted between velocity (v) and displacement (y) of a p...
Text Solution
|
- Define phase of S.H.M. Show variation of displacement, velocity and ac...
Text Solution
|
- A graph between velocity and displacement of a particle performing SHM...
Text Solution
|