Text Solution
Verified by Experts
The correct Answer is:


Similar Questions
Explore conceptually related problems
Recommended Questions
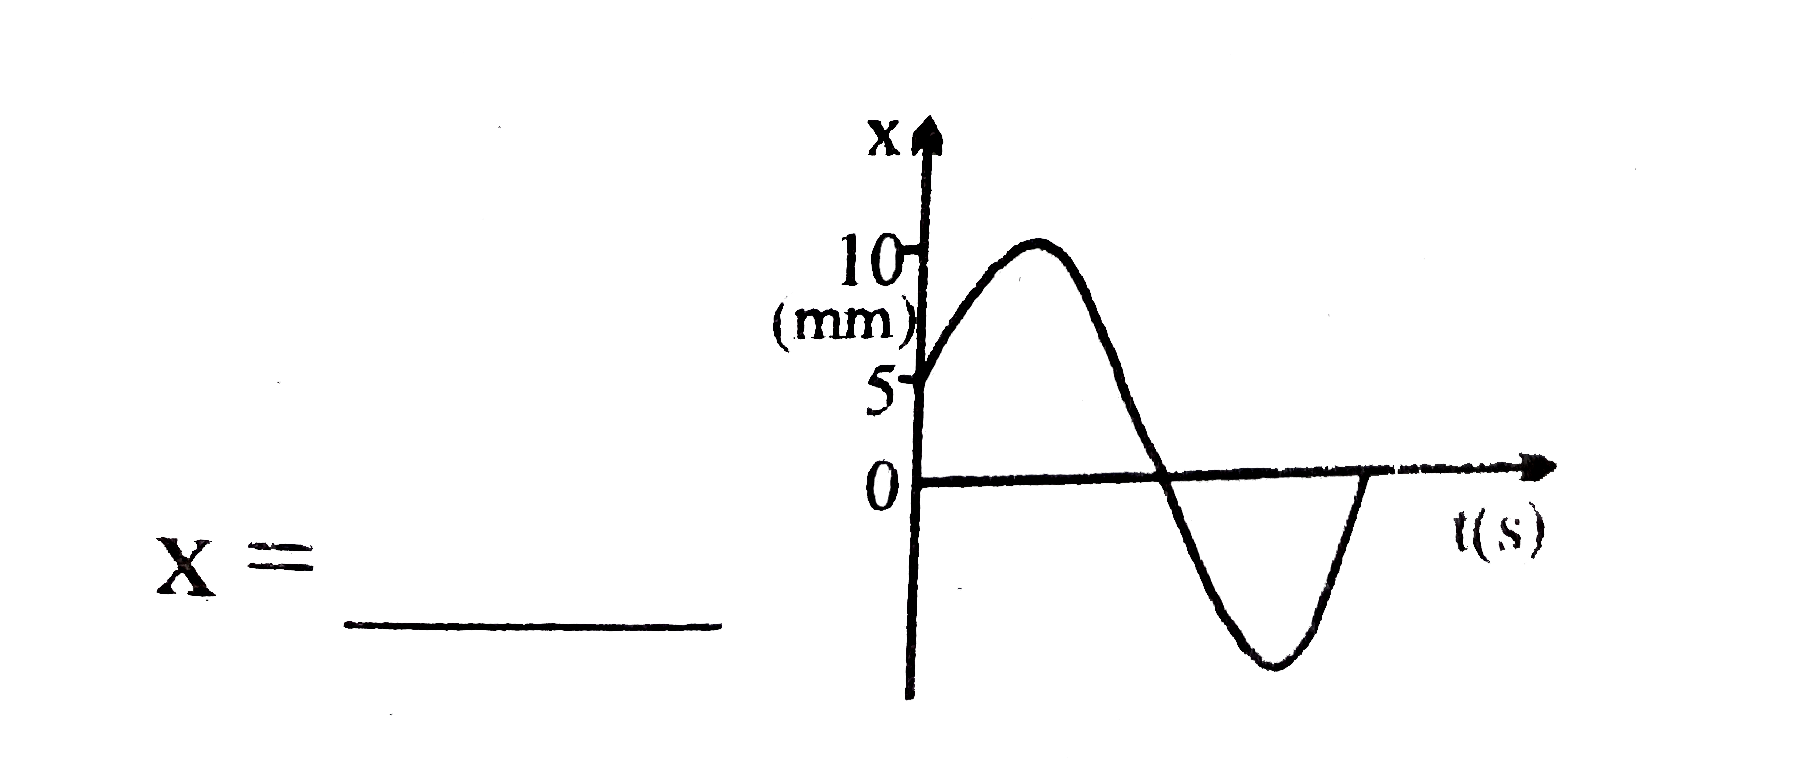
- The figure shows the displacement-time graph of a particle executing S...
Text Solution
|
- The acceleration displacement graph of a particle executing simple har...
Text Solution
|
- The acceleration versus displacement graph of a particle performing SH...
Text Solution
|
- Figure shows the graph of velocity versus displacement of a partciel e...
Text Solution
|
- Acceleration-displacement graph of a particle executing SHM Is as show...
Text Solution
|
- Acceleration -displacemnet graph of a particle executing SHM is as sho...
Text Solution
|
- Displacement-time graph of a particle executing SHM is as shown T...
Text Solution
|
- The displacement - time graph of a particle executing SHM is as shown ...
Text Solution
|
- The equation of motion of a particle executing SHM is ((d^2 x)/(dt^2))...
Text Solution
|