Text Solution
Verified by Experts


Similar Questions
Explore conceptually related problems
Recommended Questions
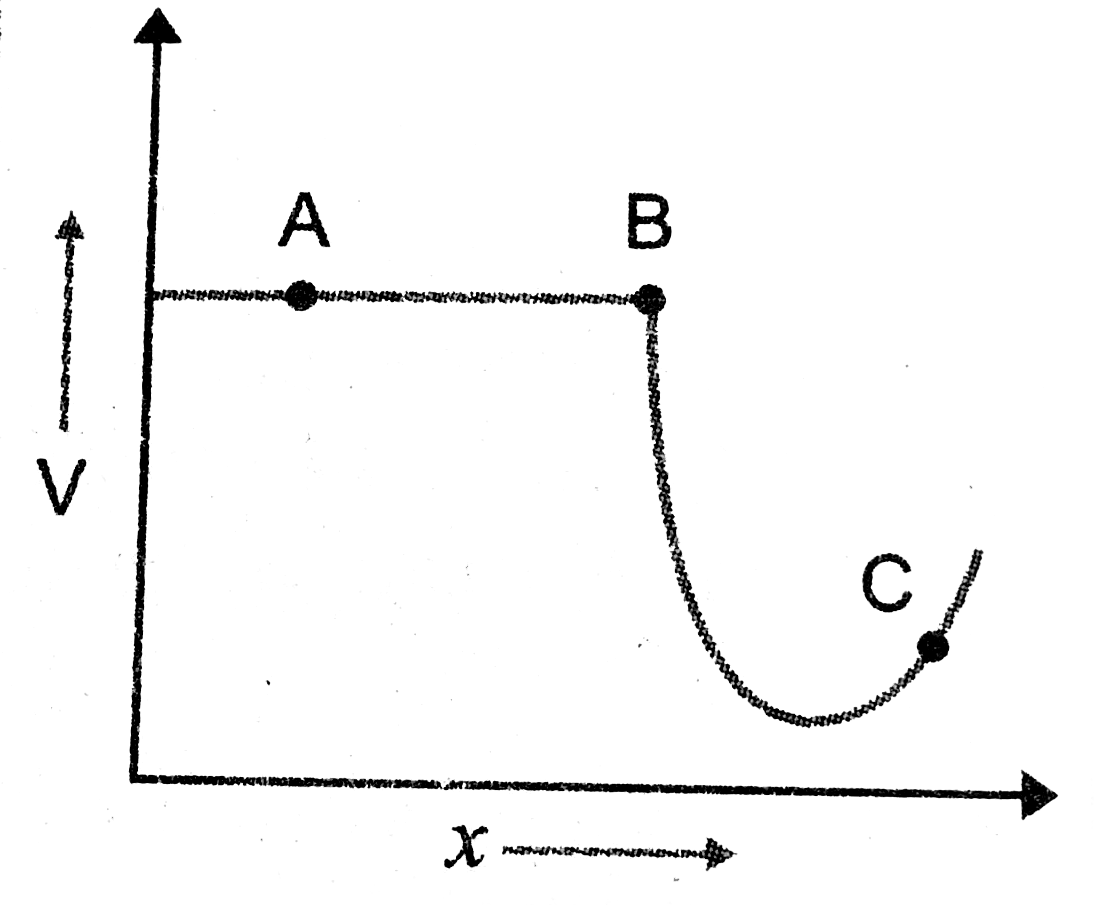
- Fig shows the variation of electrostatic potential V with distance x ...
Text Solution
|
- Is the electrostatic potential necessarily zero at a point where the e...
Text Solution
|
- Fig shows the variation of electrostatic potential V with distance x f...
Text Solution
|
- चित्र में दिए गये आवेश वितरण के लिए दुरी x के लिए विद्युत विभव V में प...
Text Solution
|
- A, B and C are three points in an electrostatics field. The electric p...
Text Solution
|
- Graphically represent the variation of electric potential and electri...
Text Solution
|
- Draw a plot showing the variation of (i) electric field (E ) and (ii) ...
Text Solution
|
- The electrical potential at a certain distance from a point charge is ...
Text Solution
|
- Is electrostatic potential necessarily zero at a point where electric ...
Text Solution
|