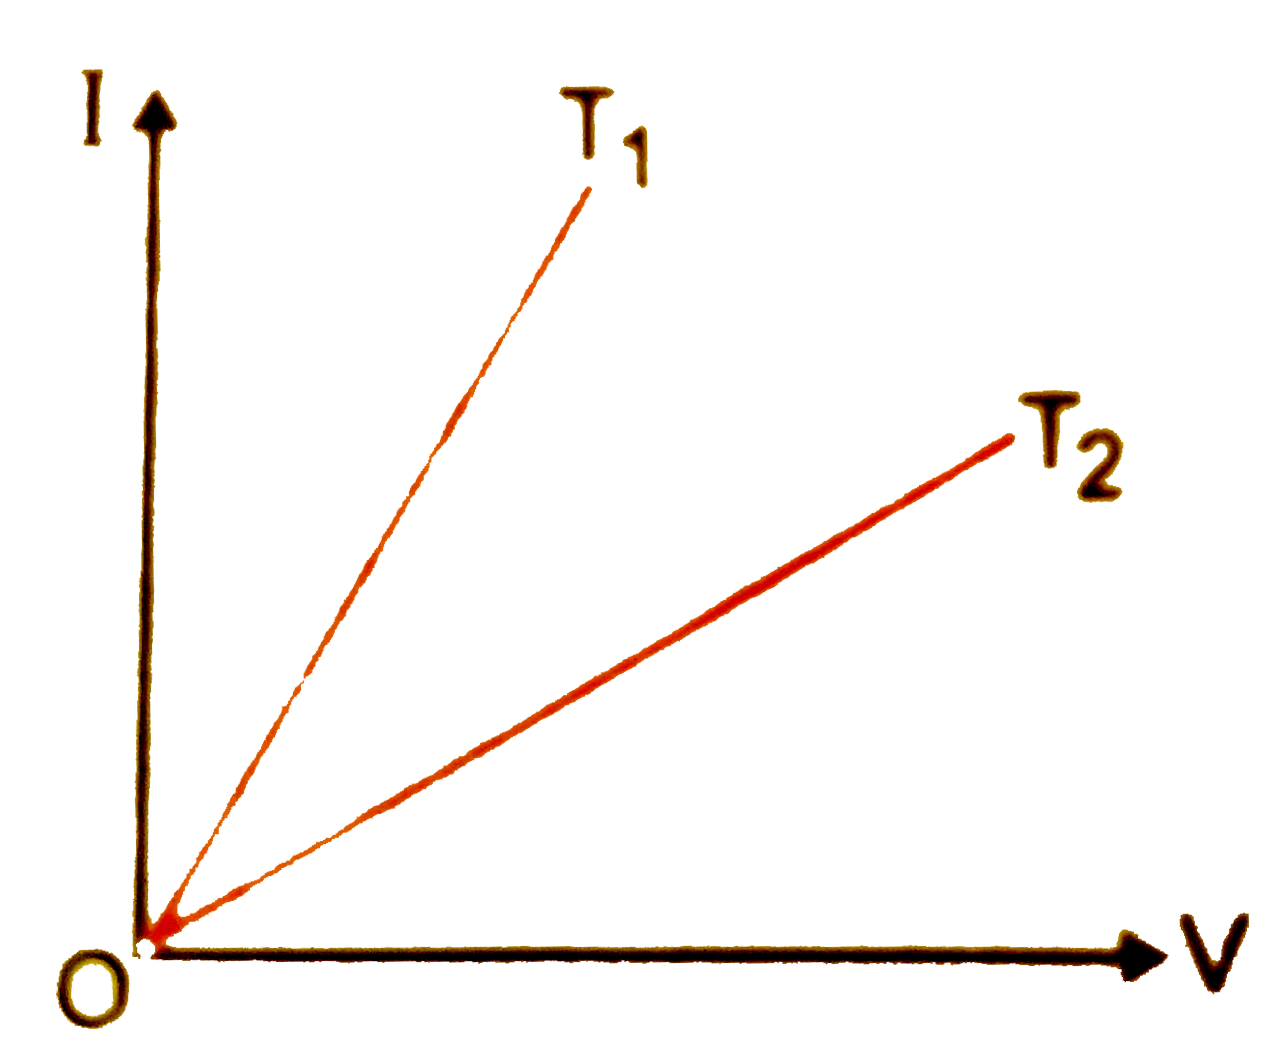
V- I graph for a metallic wire at two different temperature `T_(1)` and `T_(2)` is shown in figure. Which of the two temperature is higher and why?
Text Solution
Verified by Experts
We know that resistance, `R=V/l` From figure, for given V, `I_(1) gt I_(2)` , therefore, `R_(1) ltR_(2)`. As `R prop T_(1)` so `T_(1) lt T_(2)` i.e., `T_(2)` is greater than `T_(1)` .
Topper's Solved these Questions
CURRENT ELECTRICITY
PRADEEP|Exercise Conceptual Problems|3 Videos
CURRENT ELECTRICITY
PRADEEP|Exercise Very short Q/A|7 Videos
COMMUNICATION SYSTEMS
PRADEEP|Exercise MODEL TEST PAPER-2|9 Videos
DUAL NATURE OF RADIATION AND MATTER
PRADEEP|Exercise Exercise|191 Videos
Similar Questions
Explore conceptually related problems
I-V graph for a metallie wire at two different tempearture, T_(1)and T_(2) is as shown in the figure. Which of the two temperatures is lower and why ?
The current - voltage graphs for a given metallic wire at two different temperatures T_1 and T_2 are shown in the figure. The temperature T_2 is greater than T_1 .
The current-coltage graphs for a given metallic wire at two differenct tempeature T_(1)" and "T_(2) are shown in the figure. Which one is higher, T_(1)" or "T_(2)
The current voltage graphs for a given metalic wire two different temperature T_1 and T_2 are shown in figure The temperature T_2 is greater than T_1. Is this statement true or false?
The stress-strain graph for a metallic wire is shown at two different temperature, T_(1) and T_(2) which temperature is high T_(1) or T_(2) ?
The current (I) and voltage (V) graphs for a given metallic wire at two different temperature (T_(1)) and (T_(2)) are shown in fig. It is concluded that
PRADEEP-CURRENT ELECTRICITY-Problems for Practice (B)