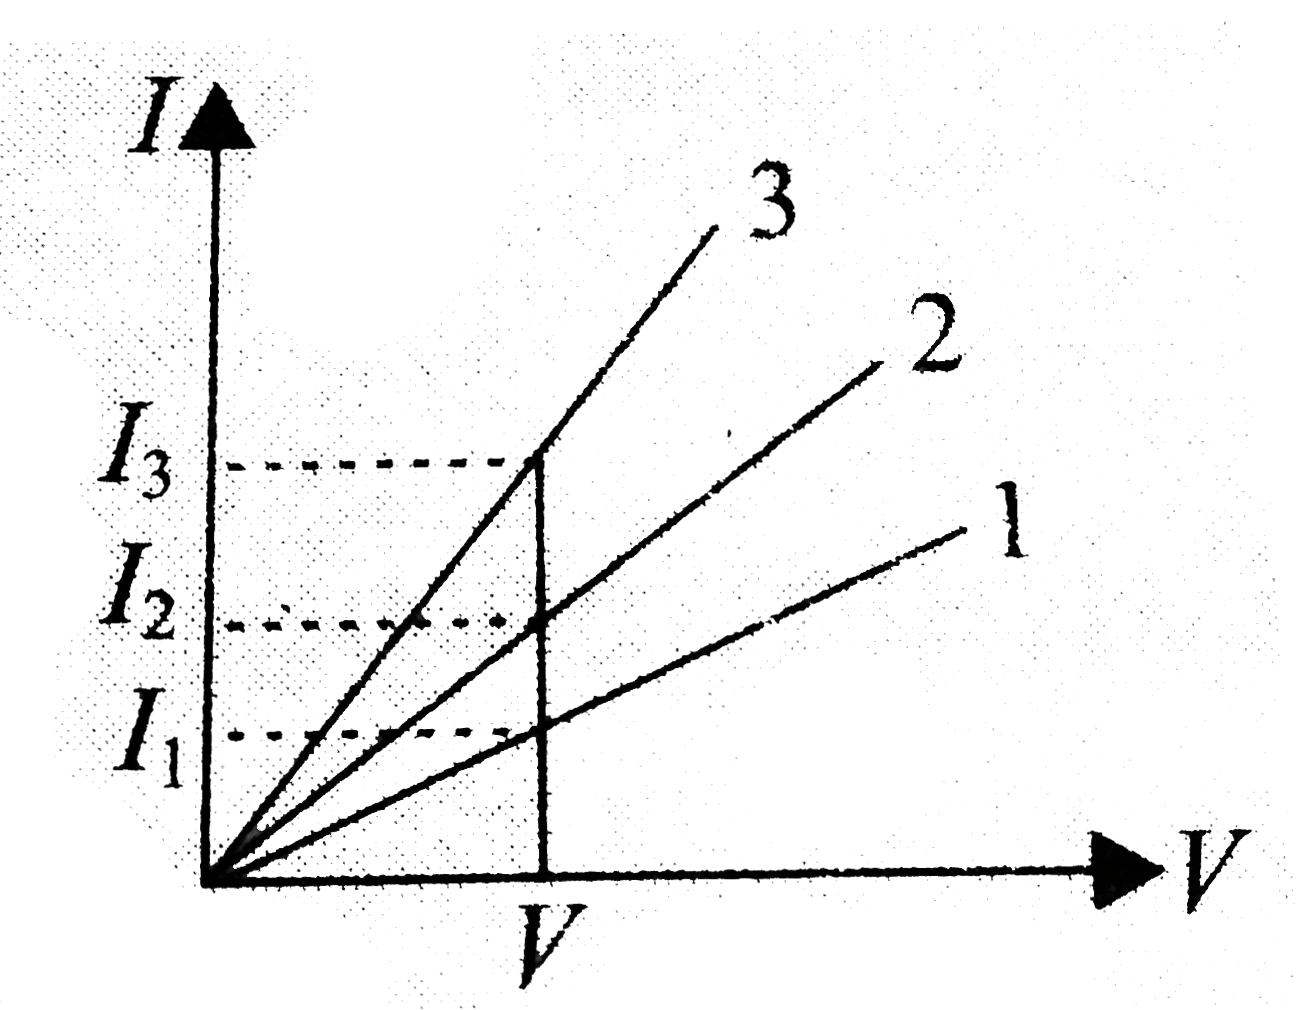
The V - I graphs for two resistors and their series combination are shown in Fig 5.23. Which one of these graphs represents the series combination of the two resistors? Given reason for your answer.
Text Solution
Verified by Experts
As slope of v-I graph `= V/I`= resistance R. From the given graphs, the slope of B is greater than that of A. So the resistance of B is greater than that of A. As resistance in series combination is more and in parallel combination is less, so B represents series combination and A represents parallel combination of resistors.
Topper's Solved these Questions
CURRENT ELECTRICITY
PRADEEP|Exercise Conceptual Problems|3 Videos
CURRENT ELECTRICITY
PRADEEP|Exercise Very short Q/A|7 Videos
COMMUNICATION SYSTEMS
PRADEEP|Exercise MODEL TEST PAPER-2|9 Videos
DUAL NATURE OF RADIATION AND MATTER
PRADEEP|Exercise Exercise|191 Videos
Similar Questions
Explore conceptually related problems
Why is resistance more in series combination of resistors ?
In the series combination of two or more than two resistances
The V-I graphs of parallel and series combinations of two metallic resistors are shown in (Fig. 3.53). Which graph represents the parallel combinations ? .
Which of the shown graphs may represent the reactance of a series L-C combination?
(a) Why does resistance increase in a series combination of resistors ? (b) Why does resistance decrease in a parallel combination of resistors ?
Discuss series and parallel combinations of resistors with their salient features.
Two students perform experiments on series and parallel combinations of two given resistors R_1 and R_1 and plot the following V -1 graphs [Fig. 5.24.]. Which of the graphs is/are correctly labeled in terms of the words 'series' and 'parallel'? Justify your answer.
Combination of Resistors|Series Combination|Parallel Combination
PRADEEP-CURRENT ELECTRICITY-Problems for Practice (B)