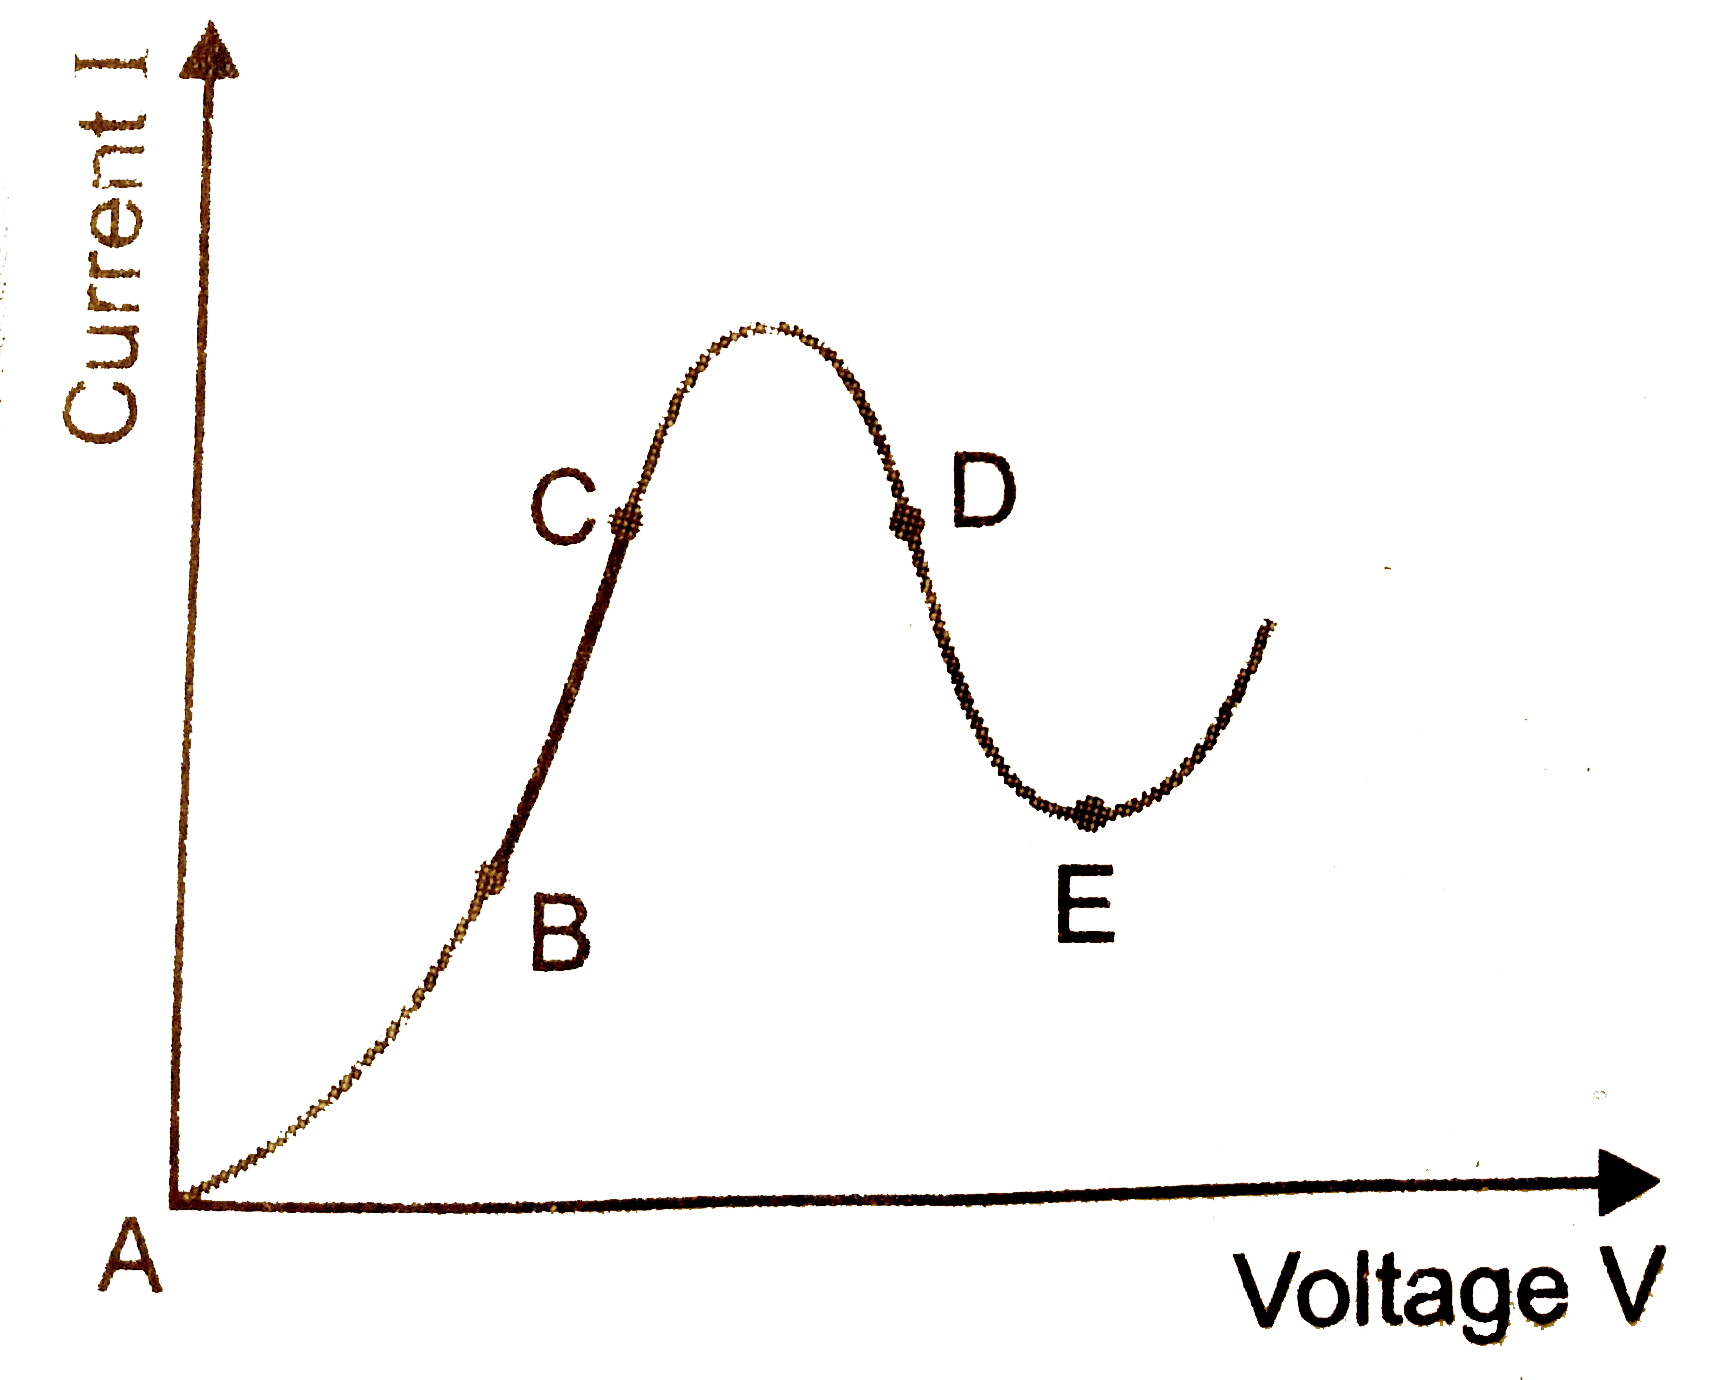
Graph showing the variation of current versus voltage for a material GaAs is shown in figure. Identify the region of (i) negative resistance (ii) where Ohm's law is obeyed.
Text Solution
Verified by Experts
(i) DE is the region of negative resistance because the slope of curve in this region is negative. (ii) BC is the region where Ohm's law is obeyed because in this part the current varies linearly with the voltage.
Topper's Solved these Questions
CURRENT ELECTRICITY
PRADEEP|Exercise Conceptual Problems|3 Videos
CURRENT ELECTRICITY
PRADEEP|Exercise Very short Q/A|7 Videos
COMMUNICATION SYSTEMS
PRADEEP|Exercise MODEL TEST PAPER-2|9 Videos
DUAL NATURE OF RADIATION AND MATTER
PRADEEP|Exercise Exercise|191 Videos
Similar Questions
Explore conceptually related problems
Plot a graph showing variation of current versus voltage for the material Ga.
Is the graph showing variation of current versus voltage for a diode linear or non-linear?
From the given between current I and voltage V shown in figure , indentify the portion corresponding to negative resistance
The graph of current versus voltage drop across the three resistors P,Q,R is shown above. Find the ratio of their resistances.
The current-voltage graph of a device is shown in figure. The resistance is negative in region.
Variation of current and voltage in a conductor is shown in the adjoining figure. The resistance of the conductor is
(a) Draw graph showing the variation of current versus voltage in an electroyte when an external resistance is also connceted. (b) (i) The graph between resistance (R ) and temperature (T) for Hg is shown in the figure (a). Explain the behaviour of Hg near 4k. (ii) In which region of the graph shown in the figure (b) is the resistance negative and why?
PRADEEP-CURRENT ELECTRICITY-Problems for Practice (B)