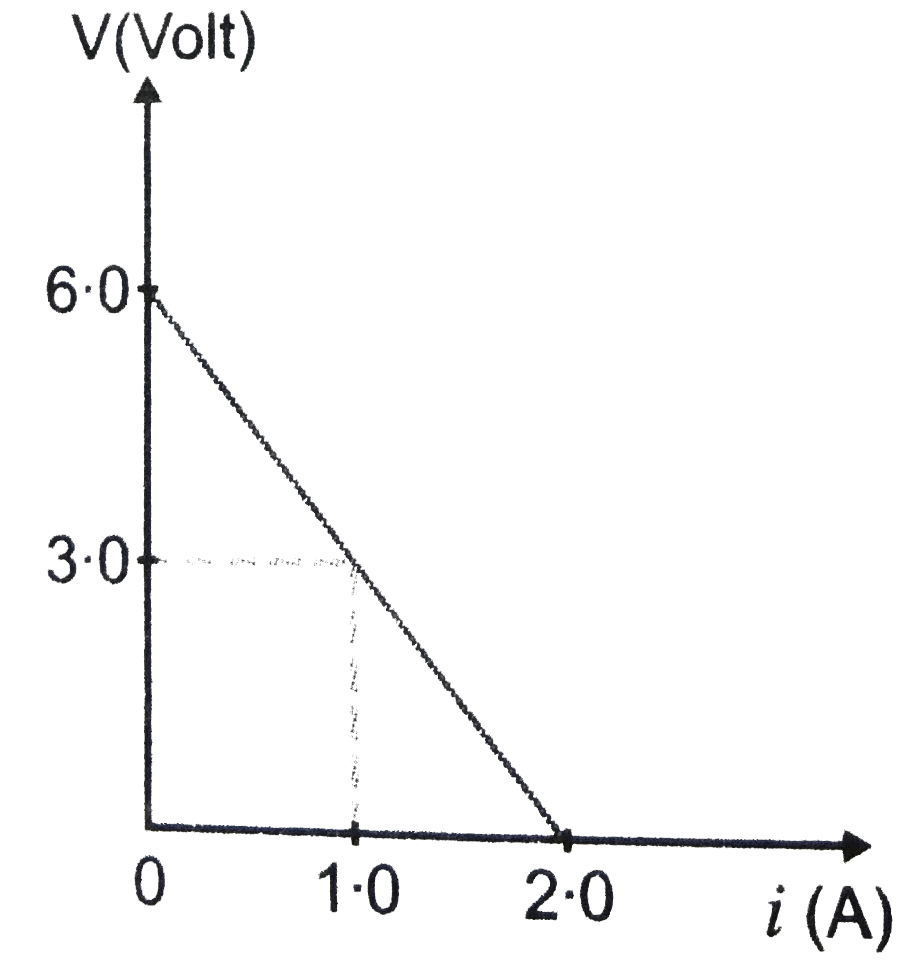
The following graph shows the variation of terminal potential difference V, across a combination of three cells in series to a resistor versus the current I : (i) Calculate the emf of each cell. (ii) For what current I, will the power dissipation of the circuit be maximum ?
Text Solution
Verified by Experts
(i) Total emf of 3 cells in series = 6.0V EMF of each cell `= 6.0/3 = 2.0V` (ii) When `i=1.0A, V = 3.0//3 =1.0V` Internal resistance of a cell `r = (epsilon- V)/i=(2.0 - 1.0)/1.0 = 1.0 Omega` The output power is maximum when external resistance = internal resistance = 3r `I_(max) = ("total emf")/("total resistance") = (3 epsilon)/(3 r + 3 r) = epsilon/2r` ` = (2.0)/(2xx1.0) = 1.0A`
Topper's Solved these Questions
CURRENT ELECTRICITY
PRADEEP|Exercise Conceptual Problems|3 Videos
CURRENT ELECTRICITY
PRADEEP|Exercise Very short Q/A|7 Videos
COMMUNICATION SYSTEMS
PRADEEP|Exercise MODEL TEST PAPER-2|9 Videos
DUAL NATURE OF RADIATION AND MATTER
PRADEEP|Exercise Exercise|191 Videos
Similar Questions
Explore conceptually related problems
The plot of the variation of potential difference across a combination of three identical cells in series, versus current is as shown in figure. What is the emf and internal resistance of each cell?
In an AC circuit with voltage V and current I , the power dissipated is
For a cell, the graph between the potential difference (V) across the terminals of the cells and the current I drawn from the cell is as shown in figure. Calculate the e.m.f. and the internal resistance of the cell.
The curve between current (i) and potential difference (V) for a photo cell will be
PRADEEP-CURRENT ELECTRICITY-Problems for Practice (B)