


Similar Questions
Explore conceptually related problems
Recommended Questions
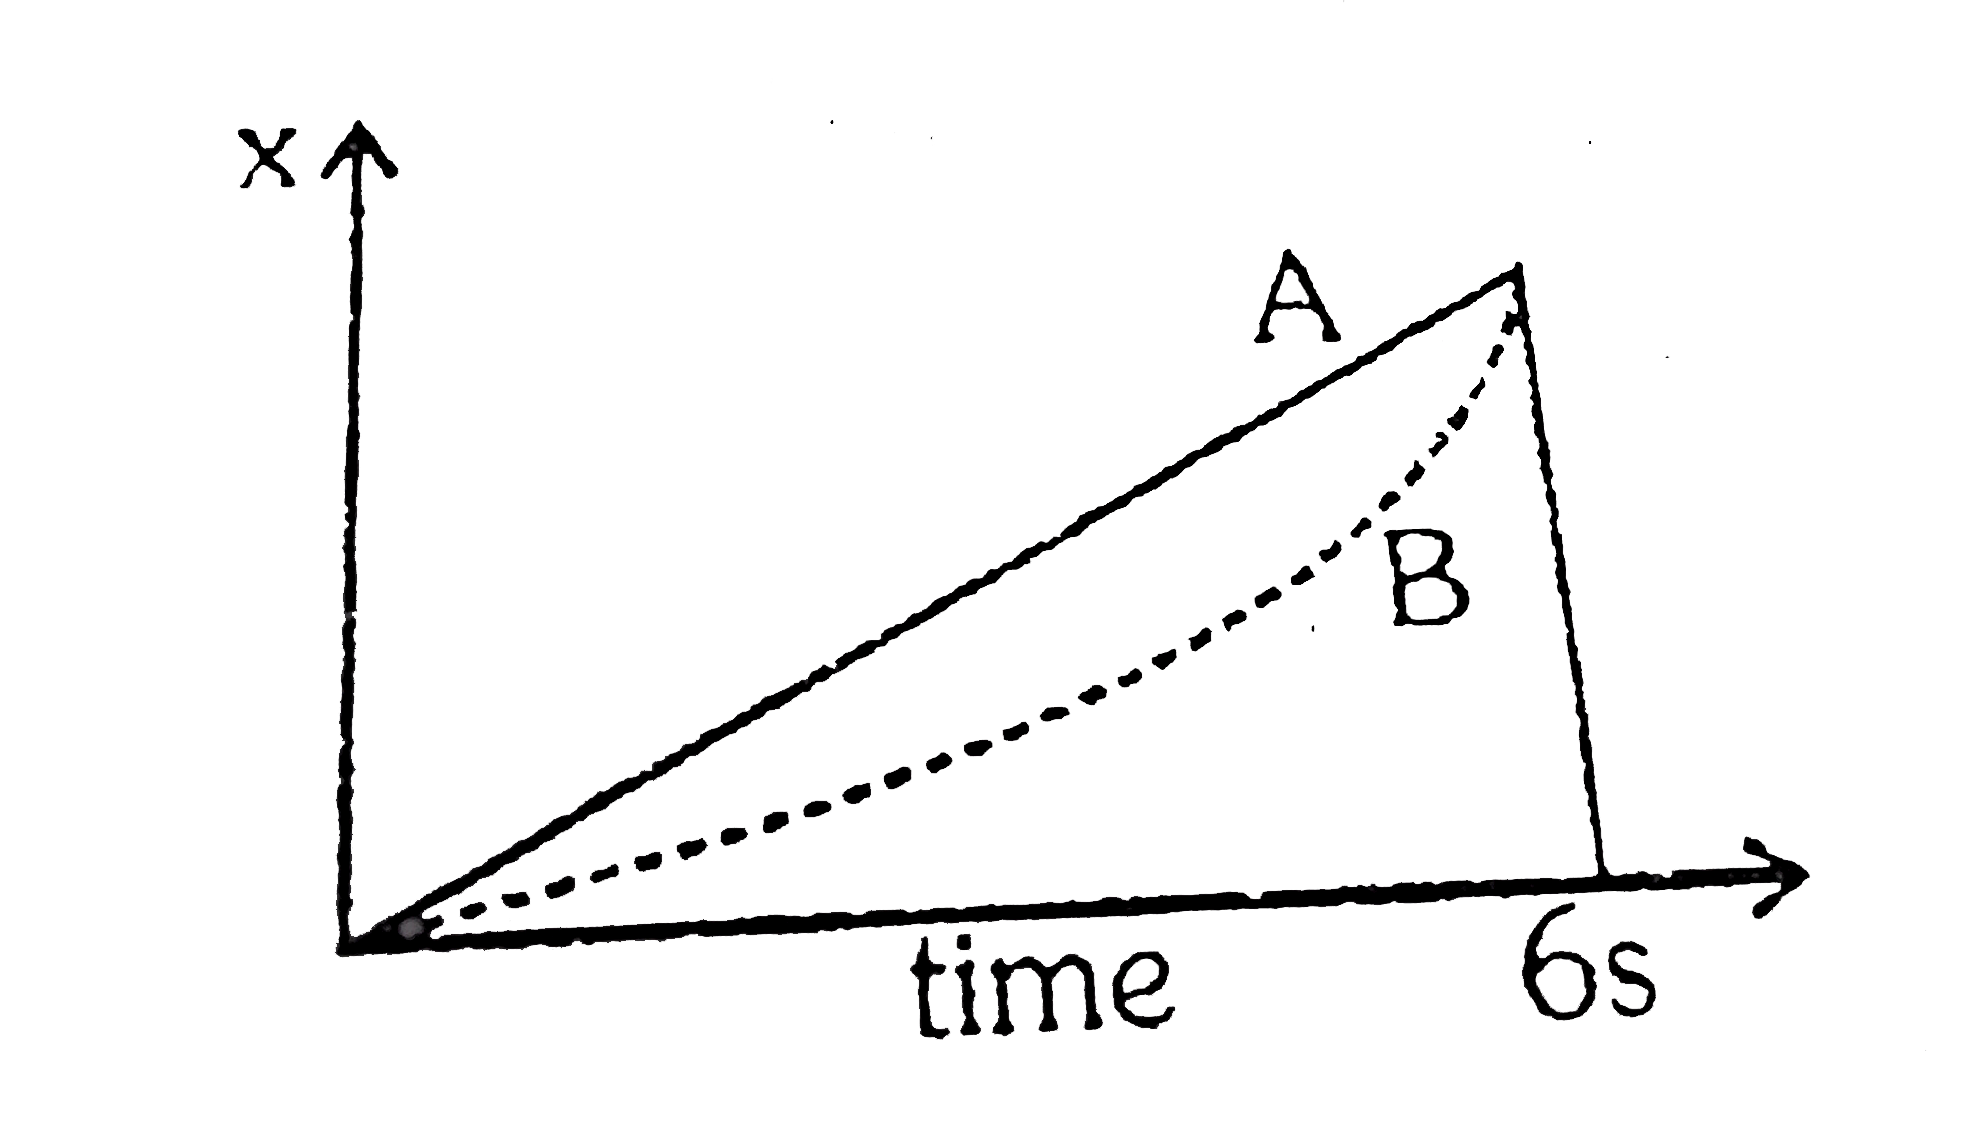
- In the diagram shown, the displacement of particles is given as a func...
Text Solution
|
- Velocity of a particle moving in a straight line varies with its displ...
Text Solution
|
- A particle is moving with a velocity of v=(3+ 6t +9t^2) m/s . Find out...
Text Solution
|
- Velocity-time graph of a particle moving in a straight line is shown i...
Text Solution
|
- Acceleration-time graph of a particle moving in a straight line is as ...
Text Solution
|
- A particle is moving under constant acceleration a=k t. The motion sta...
Text Solution
|
- In the diagram shown, the displacement of particles is given as a func...
Text Solution
|
- The acceleration-time graph of a particle moving along x-axis is shown...
Text Solution
|
- सरल रेखा में गतिमान एक कण का त्वरण (a) समय (t) ग्राफ संलग्न चित्र में ...
Text Solution
|