


Similar Questions
Explore conceptually related problems
Recommended Questions
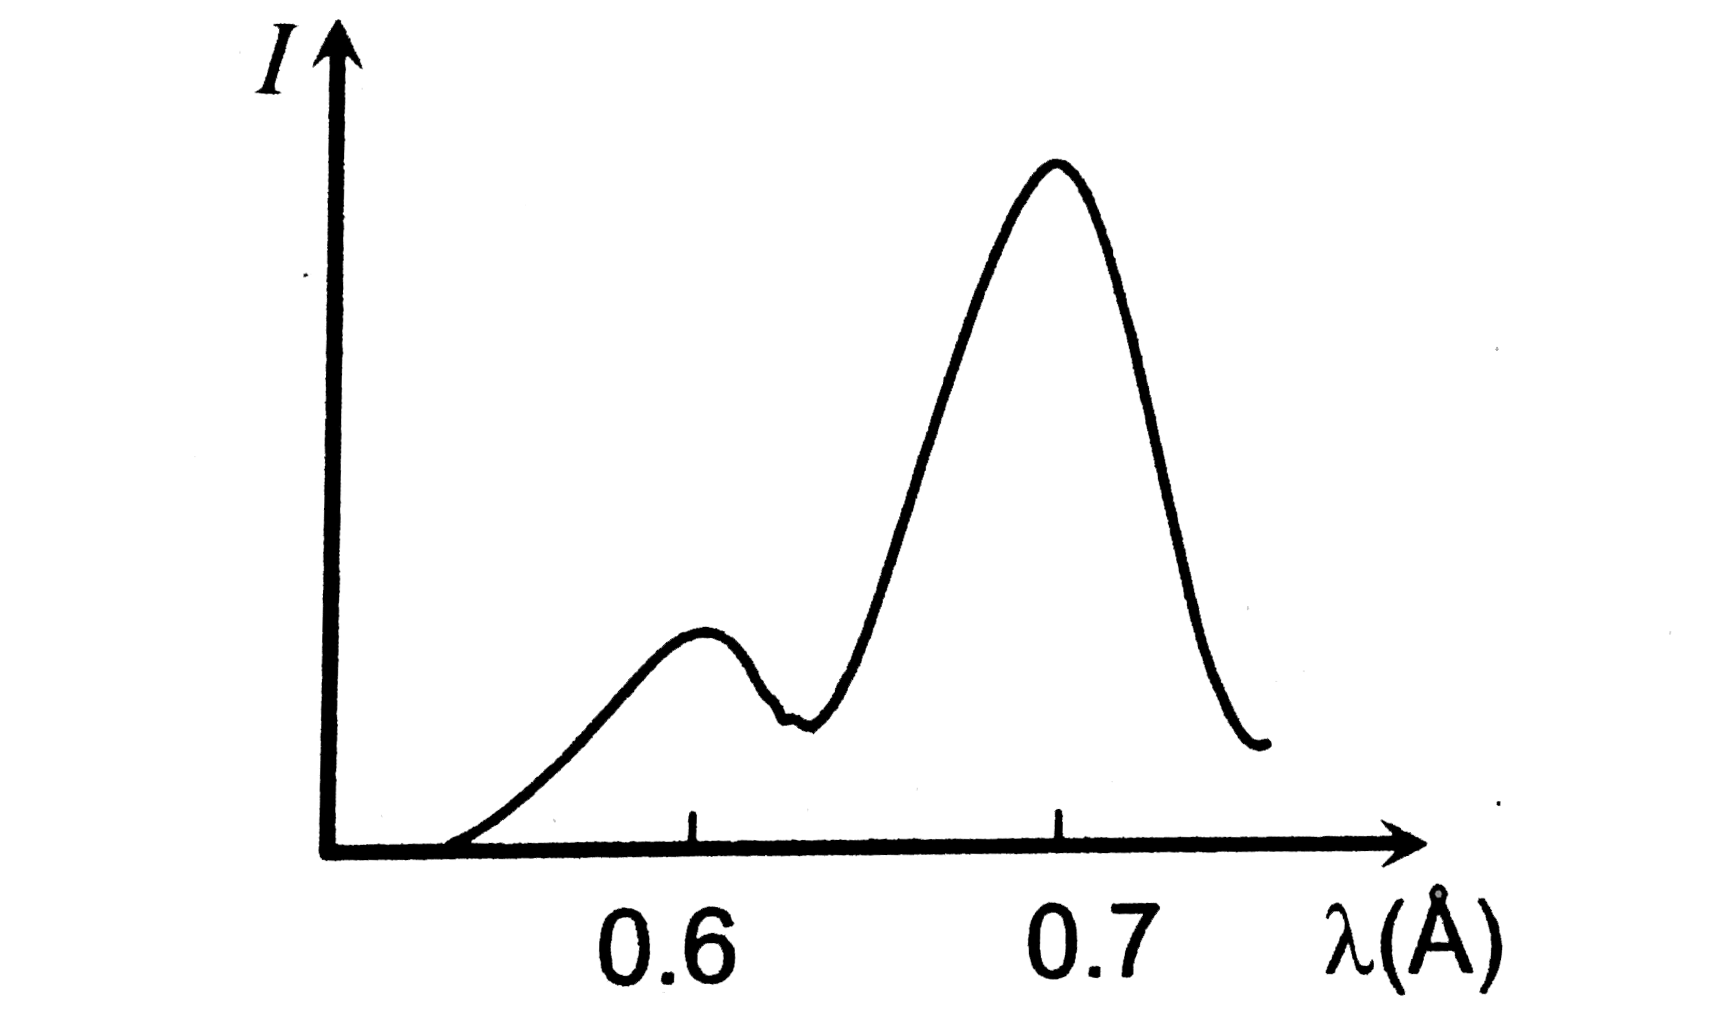
- In the diagram a graph between the intensity of X-rays emitted by a mo...
Text Solution
|
- The wavelength of the characteristic X - ray k(alpha ) line emited by ...
Text Solution
|
- The wavelength of the characteristic X-ray K(alpha) line emitted from...
Text Solution
|
- Figure shows intensity versus wavelength graph of X-rays coming from c...
Text Solution
|
- Figure shows intensity versus wavelength graph of X-rays coming from c...
Text Solution
|
- In the diagram a graph between the intensity of X-rays emitted by a mo...
Text Solution
|
- The wavelength of K(alpha) X-ray line for an element is 0.42Å . Find t...
Text Solution
|
- If a stream of electrons having kinetic energy 36 keV be incident on ...
Text Solution
|
- The wavelength of K(alpha) –line characteristic X–rays emitted by an e...
Text Solution
|