 .
.


Similar Questions
Explore conceptually related problems
Recommended Questions
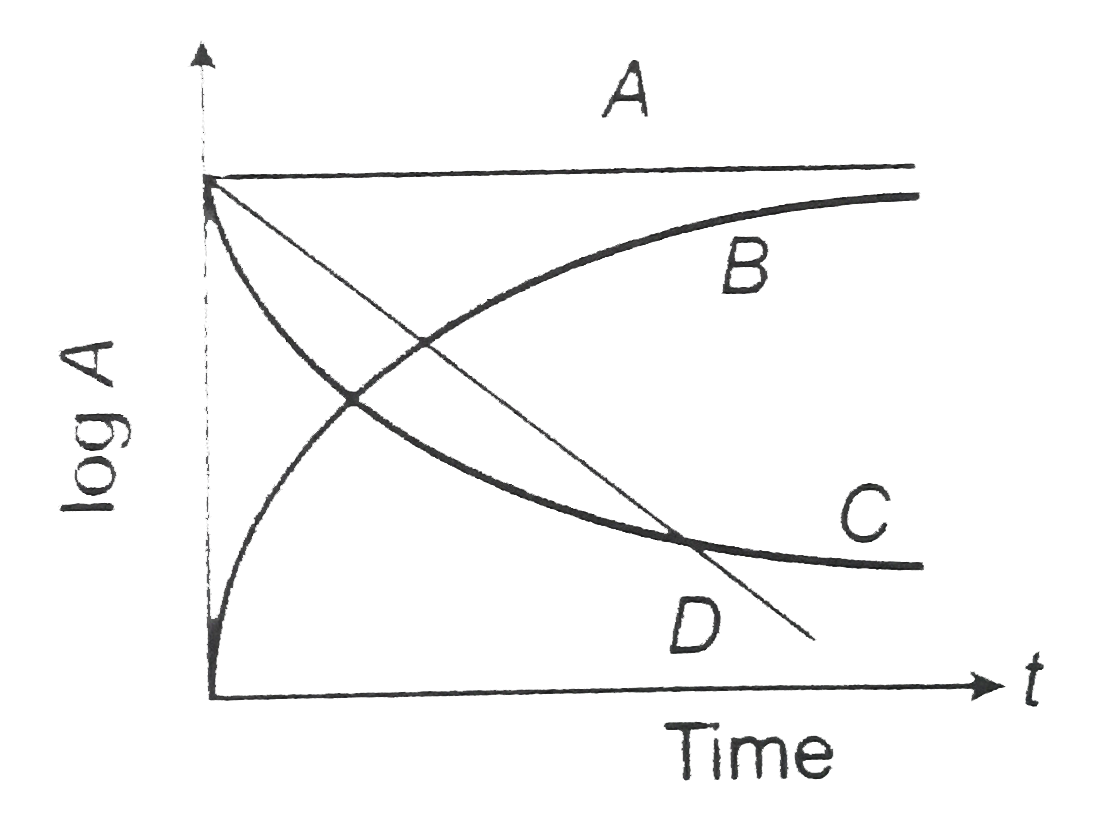
- The graph which represents the correct variation of logarithm of activ...
Text Solution
|
- A graph plotted between log k versus 1//T for calculating activation e...
Text Solution
|
- Figure shows the position the graph for a particle in one dimensional ...
Text Solution
|
- The graph which represents the correct variation of logarithm of activ...
Text Solution
|
- A particle starts to move along a straight line. The acceleration vers...
Text Solution
|
- Which of the following graphs represents the variation of activity (A)...
Text Solution
|
- The graph in figure shows the velocity v versus time t for a body. Whi...
Text Solution
|
- A ball is thrown downward with some velocity into a.viscous liquid. Wh...
Text Solution
|
- Graph between velocity and displacement is shown in the following figu...
Text Solution
|