


Similar Questions
Explore conceptually related problems
Recommended Questions
- In a photoelectric effect experiment, the graph between the stopping p...
Text Solution
|
- The stopping potential as a function of the frequency of the incident ...
Text Solution
|
- In the study of a photoelectric effect the graph between the stopping ...
Text Solution
|
- In a photoelectric effect experiment, the graph between the stopping p...
Text Solution
|
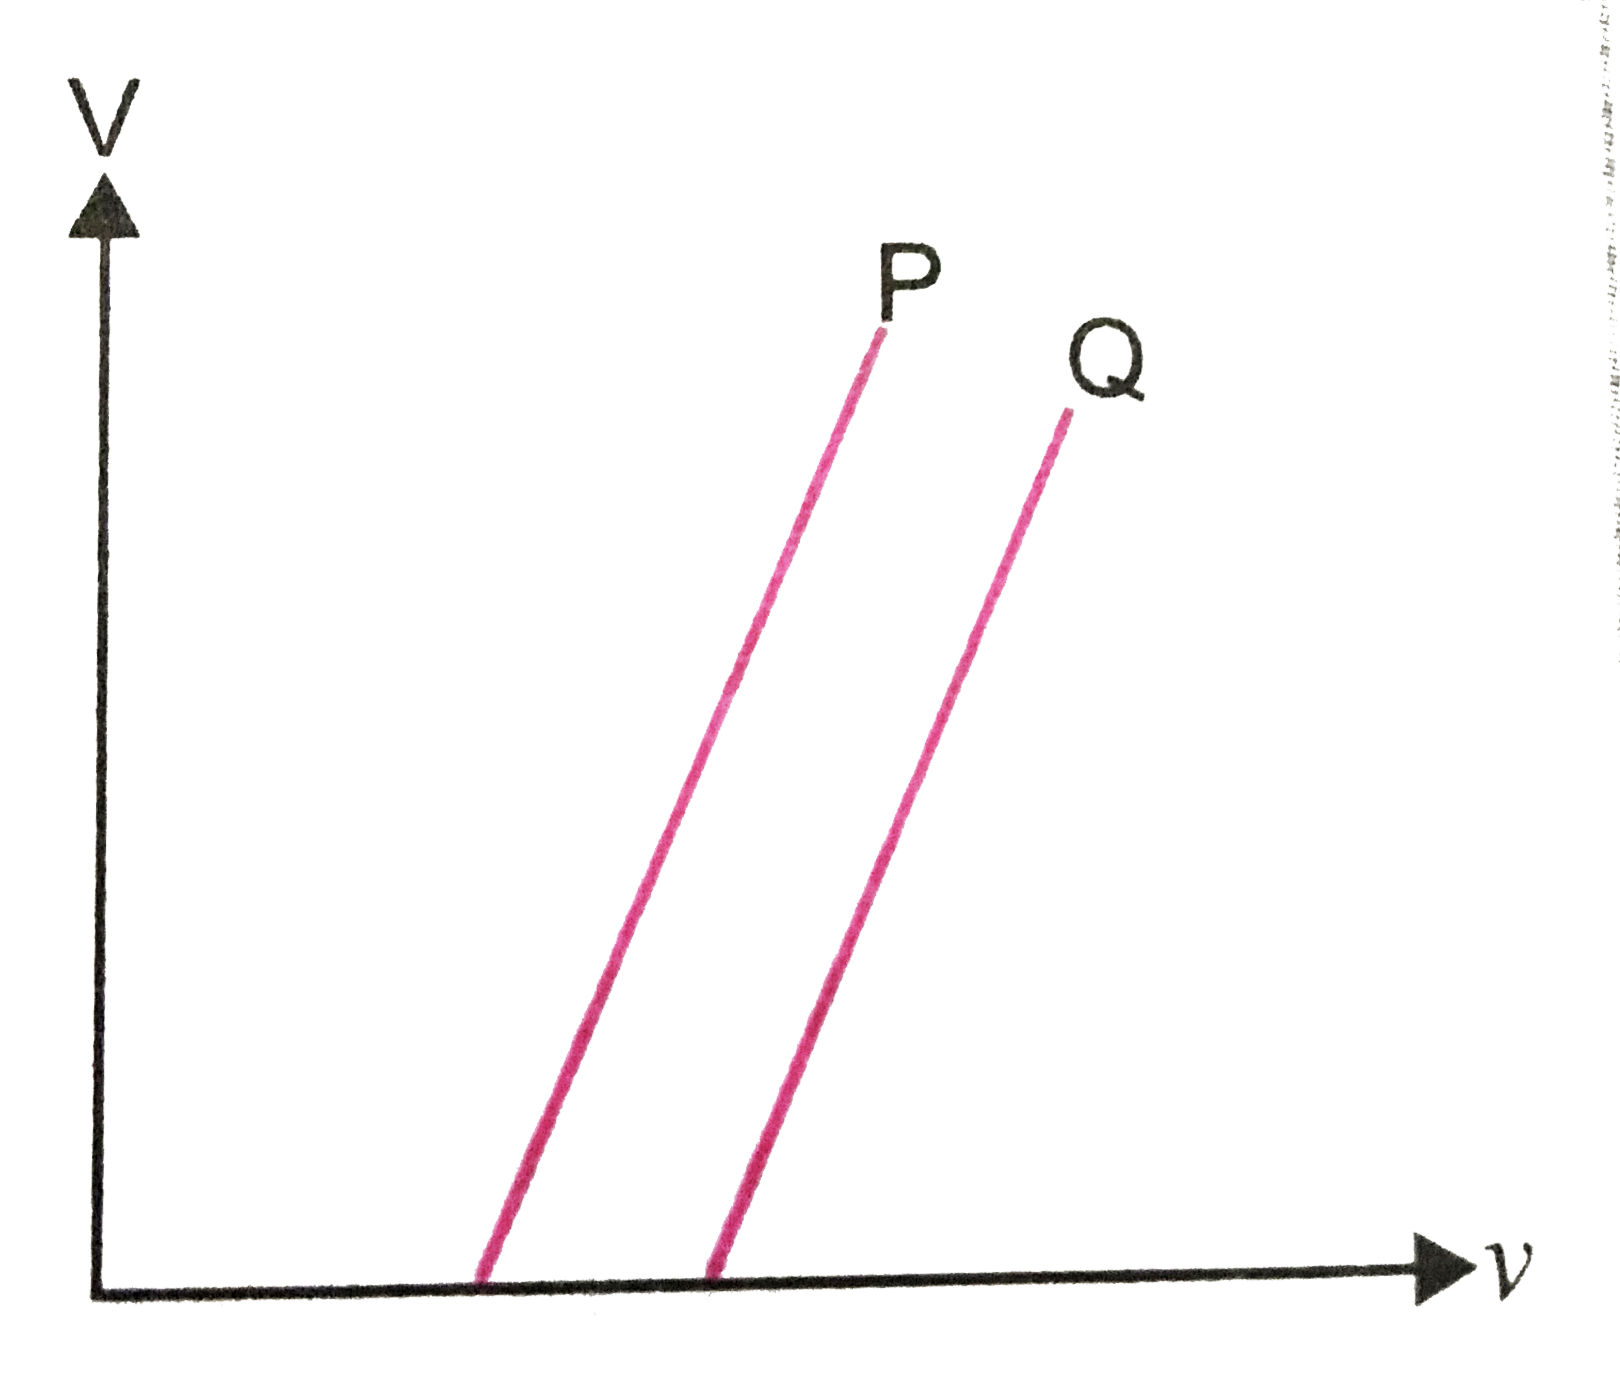
- The graph between the stopping potential V(0) and frequency v for two ...
Text Solution
|
- In photoelectric effect the slope of straight line graph between stopp...
Text Solution
|
- In photoelectric effect the slope of straight line graph between stopp...
Text Solution
|
- The stopping potential as a function of frequency of incident radiatio...
Text Solution
|
- In a photoelectric experiment, the reciprocal of the slope of the st...
Text Solution
|