A
B
C
D
Text Solution
Verified by Experts
The correct Answer is:


Topper's Solved these Questions
STATES OF MATTER : GASES AND LIQUIDS
MARVEL PUBLICATION|Exercise TEST YOUR GRASP|50 VideosSTATES OF MATTER : GASES AND LIQUIDS
MARVEL PUBLICATION|Exercise HIGHER LEVEL|35 VideosSOLID STATE
MARVEL PUBLICATION|Exercise Multiple choice questions|183 VideosSURFACE CHEMISTRY
MARVEL PUBLICATION|Exercise TEST YOUR GRASP|35 Videos
Similar Questions
Explore conceptually related problems
MARVEL PUBLICATION-STATES OF MATTER : GASES AND LIQUIDS -NUMERICALS
- Five grams each of the following gases at 87^(@)C and 750 mm pressure ...
Text Solution
|
- 10 mL of a gaseous hydrocarbon require 30 mL of oxygen for complete co...
Text Solution
|
- Study the figures below and identify the type of interaction between X...
Text Solution
|
- What is the relationship between thermal energy and intermolecular int...
Text Solution
|
- Atmospheric pressure recorded in different cities are as follows : ...
Text Solution
|
- The drain cleaner Drainex contains small bits of aluminium which react...
Text Solution
|
- For a real gas the compressibility factor Z has different values at di...
Text Solution
|
- Study the following graph and mark the incorrect statement following i...
Text Solution
|
- Which curve (in figure ) represents the curve of ideal gas ?
Text Solution
|
- Match the column I with column II and mark the appropriatre choice.
Text Solution
|
- The molecules of a gas are in constant (i) motion . They move in (ii)...
Text Solution
|
- A graph between vapour pressure and temperature of few liquids is give...
Text Solution
|
- Assertion : At high altitudes liquids boil at lower temperaturers in c...
Text Solution
|
- Assertion : Viscosity of liquids decreases as the temperature rises. ...
Text Solution
|
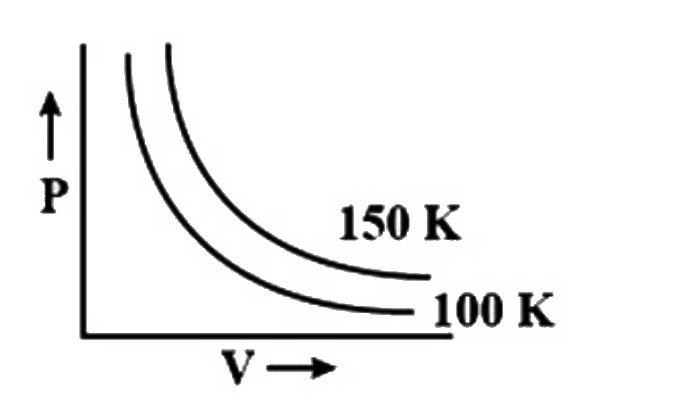
- A graph is plotted between pressure and volume at different temperatur...
Text Solution
|
- Two atoms X and Y are non-polar and electrically symmetrical. What typ...
Text Solution
|
- A container of 1 L capacity contains a mixture of 4 g of O(2) and 2 g ...
Text Solution
|
- Ideal gas equation is also called equation of states bacause
Text Solution
|
- If average velocity of a sample of gas molecules at 300 K is 5 cm s^(-...
Text Solution
|
- A gases mixture contains oxygen and nitrogen in the ratio 1 : 4 by wei...
Text Solution
|