


Similar Questions
Explore conceptually related problems
Recommended Questions
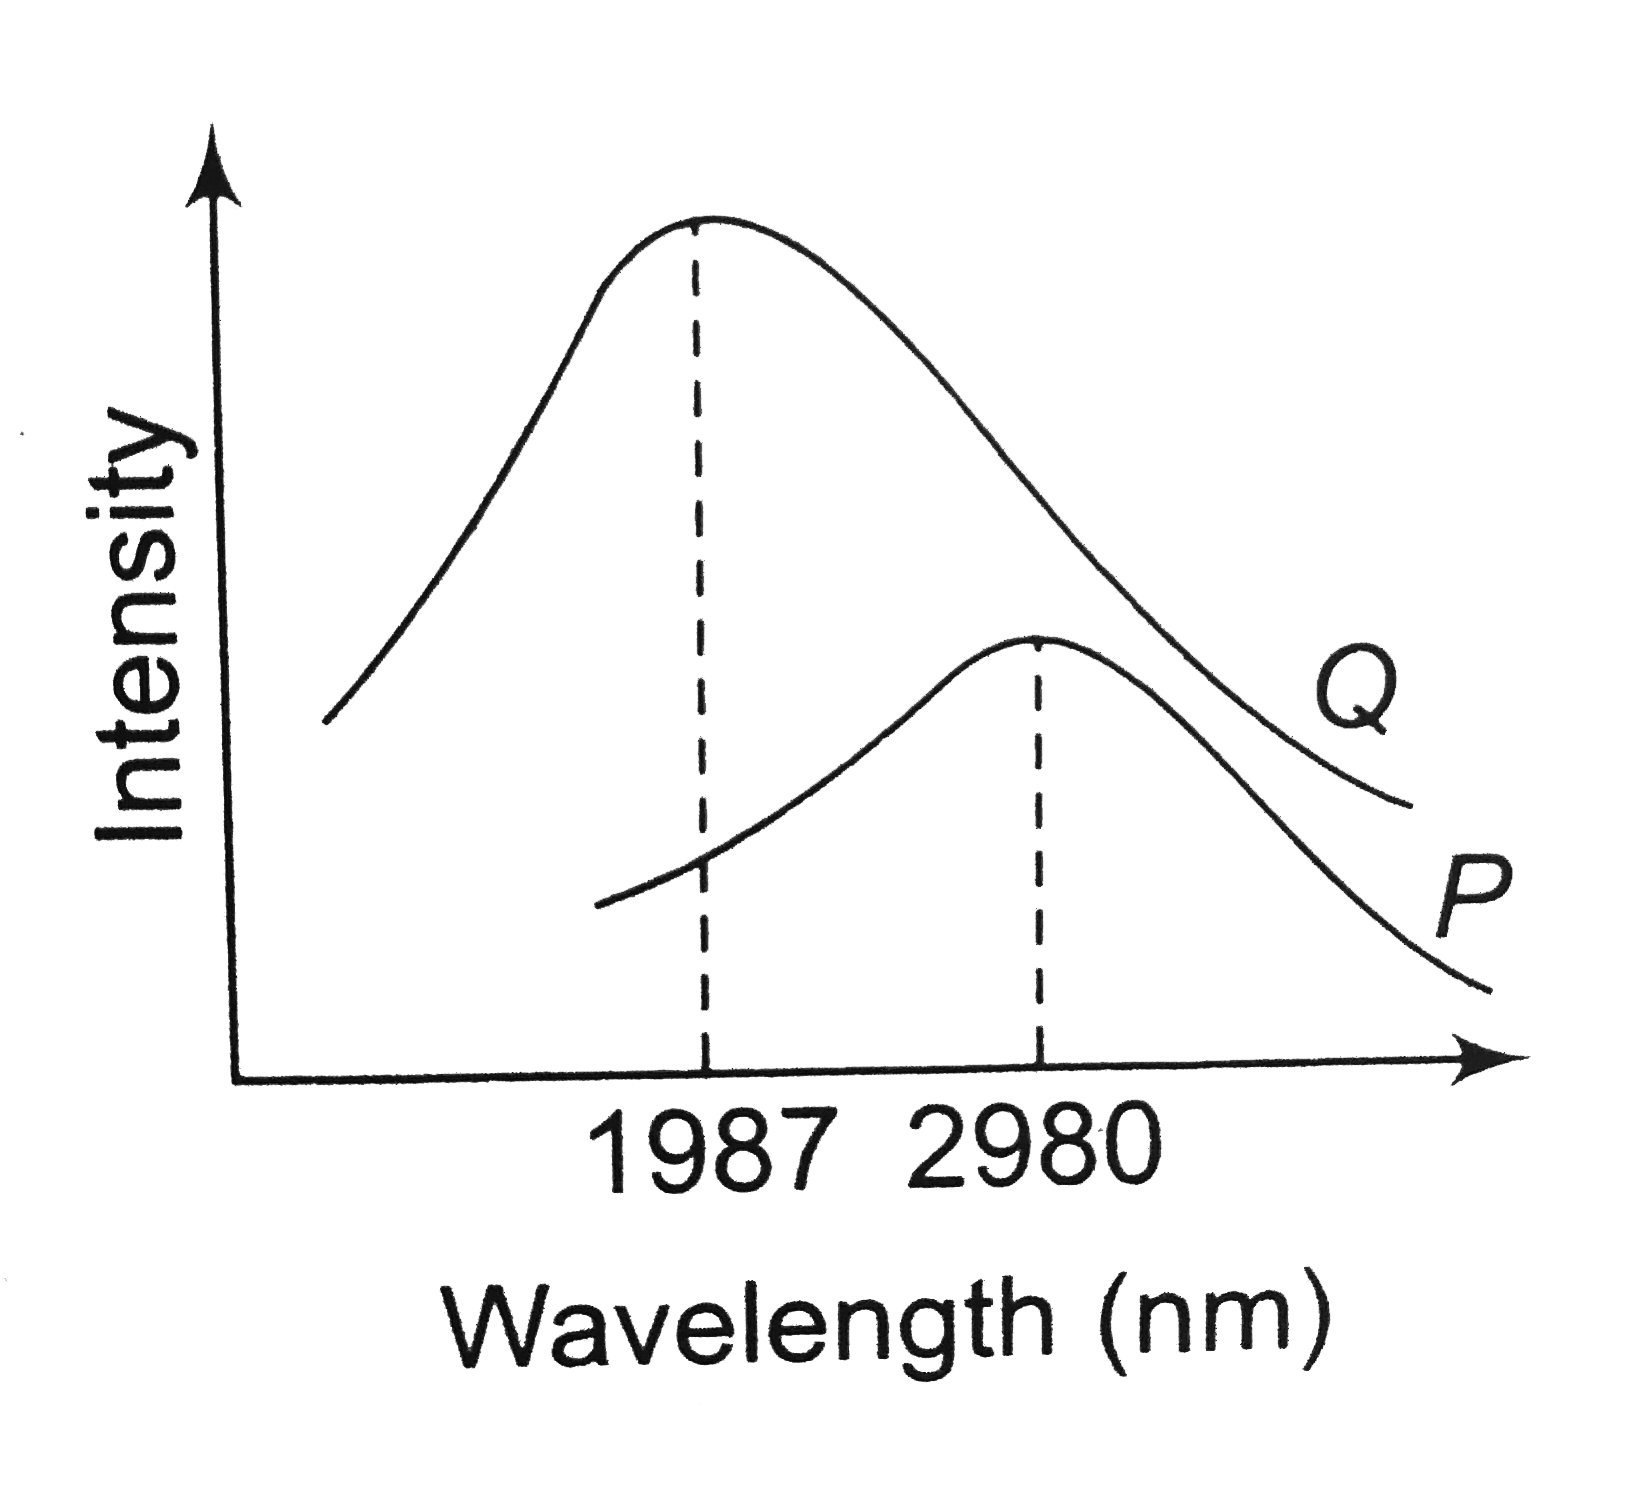
- The emission spectrum of a black body at two different temperatures ar...
Text Solution
|
- The strain stress curves of three wires of different materials are sho...
Text Solution
|
- The spectrum of a black body at two temperatures 27^(@)C and 327^(@)C ...
Text Solution
|
- The emission spectrum of a black body at two different temperatures ar...
Text Solution
|
- The spectra of a black body at temperatures 273^(@)C and 546^(@)C are ...
Text Solution
|
- If the B-H curves of two samples of P and Q of iron are as shown below...
Text Solution
|
- Two particles P and Q are moving as shown in the figure. At this momen...
Text Solution
|
- The strain-stress curves of three wire of different materials are show...
Text Solution
|
- दिए गए चित्र में XY एक अनन्त रेखीय आवेश वितरण है, बिन्दु P तथा Q चित...
Text Solution
|