


Similar Questions
Explore conceptually related problems
Recommended Questions
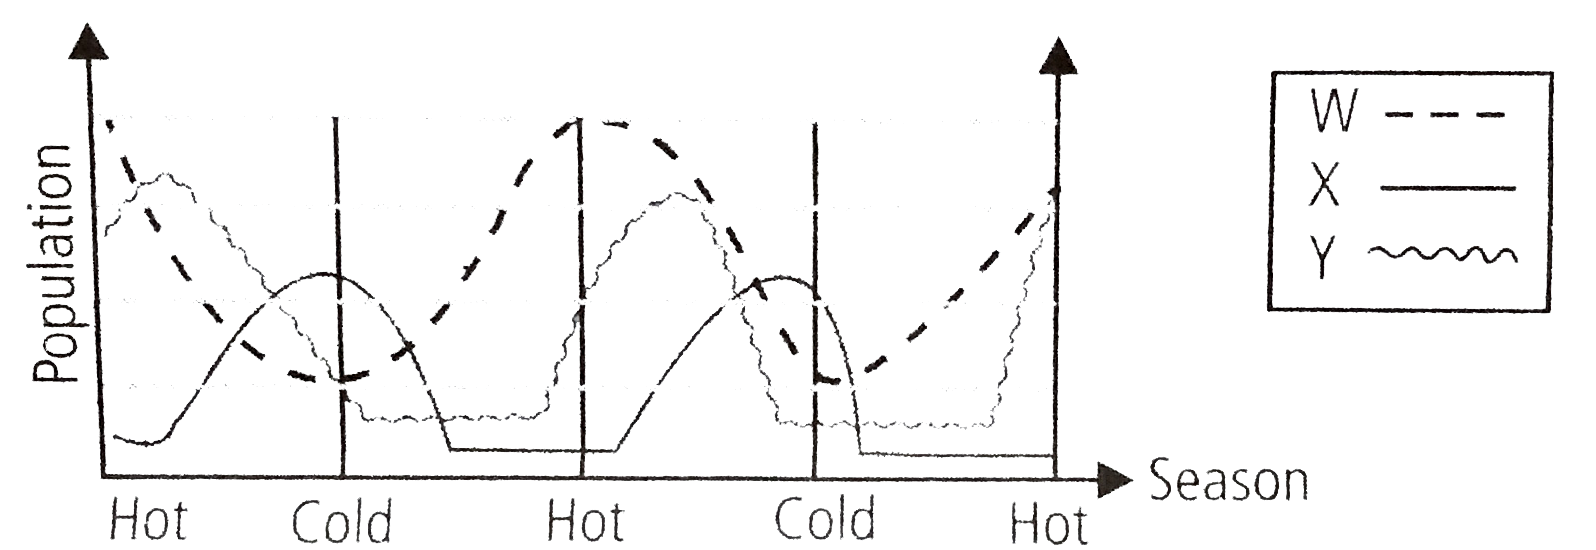
- The graph given below shows the variations in the population of produc...
Text Solution
|
- The given graph shows the variation of velocity with displacement. Whi...
Text Solution
|
- The graph given below shows the variations in the population of produc...
Text Solution
|
- द्वितीयक उत्पादक अथवा प्राथमिक उपभोक्ता है:
Text Solution
|
- प्राथमिक एवं द्वितीयक उपभोक्ताओं का एक-एक उदाहरण दीजिए।
Text Solution
|
- The given ecological pyramid is TC (Tertiary consumer) SC (Secondary c...
Text Solution
|
- Which one is a primary consumer in a pond ecosystem ?
Text Solution
|
- नीचे दिया गया आलेख एक तालाब में उत्पादकों, प्राथमिक उपभोक्ताओं व द्वित...
Text Solution
|
- The graph given below shows the variations in the population of produc...
Text Solution
|