A
B
C
D
Text Solution
Verified by Experts
The correct Answer is:


Topper's Solved these Questions
MECHANICAL PROPERTIES OF SOLIDS
NARAYNA|Exercise LEVEL-I (C.W)|37 VideosMECHANICAL PROPERTIES OF SOLIDS
NARAYNA|Exercise LEVEL-II (C.W)|32 VideosMECHANICAL PROPERTIES OF SOLIDS
NARAYNA|Exercise LEVEL-II (H.W)|24 VideosMECHANICAL PROPERTIES OF FLUIDS
NARAYNA|Exercise EXERCISE - III|30 VideosMOTION IN A PLANE
NARAYNA|Exercise Level-II(H.W)|31 Videos
Similar Questions
Explore conceptually related problems
NARAYNA-MECHANICAL PROPERTIES OF SOLIDS-C.U.Q
- The diagram represents the applied force per unit area (F) with the...
Text Solution
|
- A unifrom rod is fixed at one end to a rigid support, its temperture ...
Text Solution
|
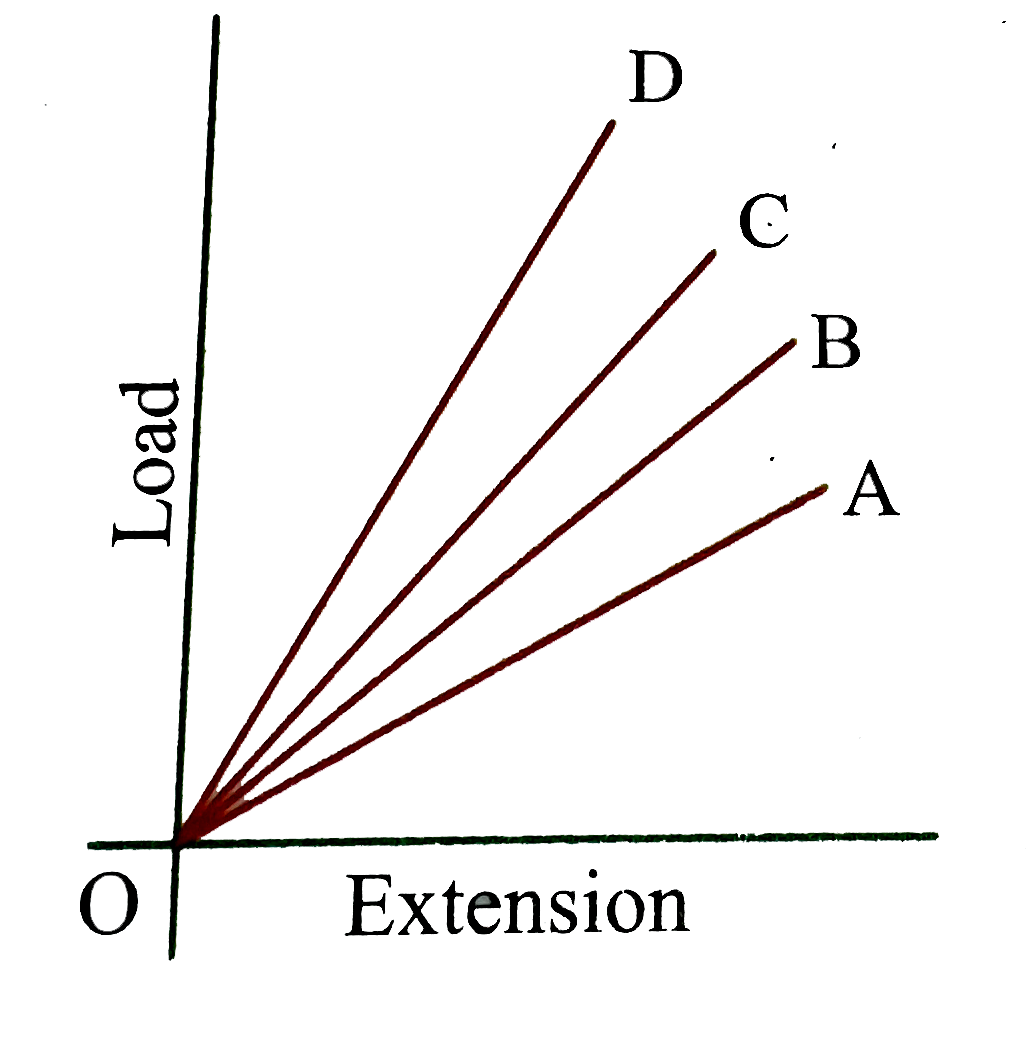
- The load versus extension graph for four wires of same material is sh...
Text Solution
|
- Which of the following stress versus strain curve representes cast iro...
Text Solution
|
- A graph is shown between stress and strain for a metal. The part in w...
Text Solution
|
- In the above graph, point B indicates
Text Solution
|
- In the above graph, point D indicates
Text Solution
|
- The strain stress curves of three wires of different materials are sho...
Text Solution
|
- The diagram shows a forc-extension graph for a rubber band. Consider...
Text Solution
|
- The stress versus strain graphs for wires of two materials A and B are...
Text Solution
|
- The load versus extension graph for four wires of same material is sh...
Text Solution
|
- When does an elastic metal rod change its length?
Text Solution
|
- The graph show the behaviour of a length of wire in the region for whi...
Text Solution
|
- The potential energy U between two molecules as a function of the dis...
Text Solution
|
- The value of force constant between the applied elastic force F and di...
Text Solution
|
- The diagram shoes stress v/s strain curve for the materials A and B. F...
Text Solution
|
- What happens to the elastic property of a substance after annealing...
Text Solution
|
- If a metal wire of length L, having area of cross-section A and Young...
Text Solution
|
- the points of maximum and minimum attraction in the curve between pote...
Text Solution
|
- The linear strain in x,y and z direction are e(x),e(y) and e(z) resp...
Text Solution
|