


Similar Questions
Explore conceptually related problems
Recommended Questions
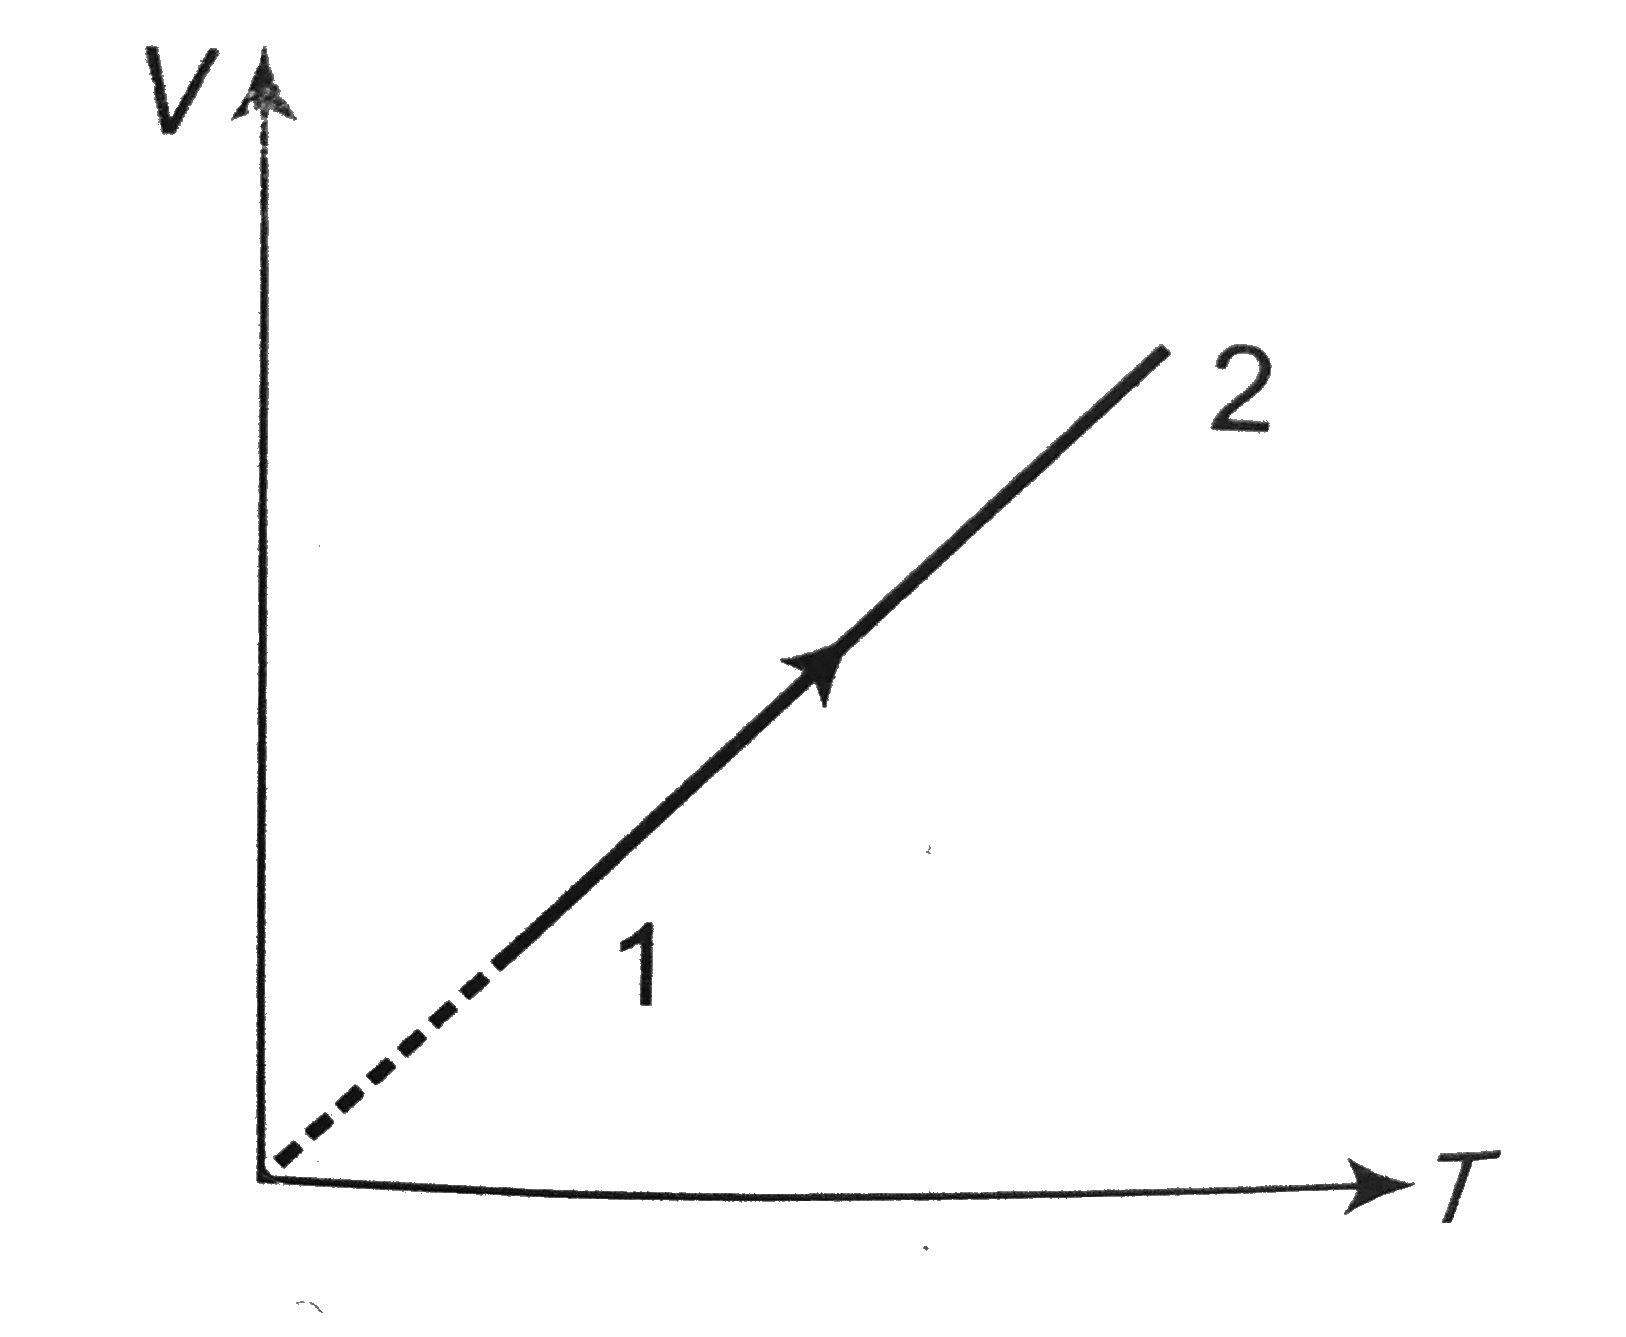
- Volume versus temperature graph of two moles of helium gas is as shown...
Text Solution
|
- The ratio of heat absorbed and work done by the gas in the process, as...
Text Solution
|
- Volume versus temperature graph of two moles of helium gas is as shown...
Text Solution
|
- An ideal monoatomic gas undergoes a cyclic process ABCA as shown in th...
Text Solution
|
- किसी एकपरमाणुक गैस के आयतन (V) में ताप (T) के साथ विचरण ग्राफ में दर्श...
Text Solution
|
- एकपरमाणुक आदर्श गैस के 1 मोल को चित्र में दिखाए गए चक्रीय प्रक्रम ABCA...
Text Solution
|
- A graph drawn between absolute temperature and volume of 3 moles of he...
Text Solution
|
- दो मोल हीलियम गैस चक्र ABCDA के लिये ली गई है जैसा P-T ग्राफ में प्रदर...
Text Solution
|
- दो मोल हीलियम गैस चक्र ABCDA के लिये ली गई है जैसा P-T ग्राफ में प्रदर...
Text Solution
|