 .
.A
B

C
D
Text Solution
Verified by Experts
The correct Answer is:


Topper's Solved these Questions
TRANSMISSION OF HEAT
NARAYNA|Exercise LEVEL-I(H.W)|19 VideosTRANSMISSION OF HEAT
NARAYNA|Exercise LEVEL-II(C.W)|27 VideosTRANSMISSION OF HEAT
NARAYNA|Exercise SINGLE ANSWER QUESTIONS Passage -1|1 VideosTHERMODYNAMICS
NARAYNA|Exercise Exercise|187 VideosUNITS AND MEASUREMENTS
NARAYNA|Exercise STATEMENT TYPE QUESTION|23 Videos
Similar Questions
Explore conceptually related problems
NARAYNA-TRANSMISSION OF HEAT-SINGLE ANSWER QUESTIONS
- Three rods AB, BC and BD of same length l and cross-sectionsl area A ...
Text Solution
|
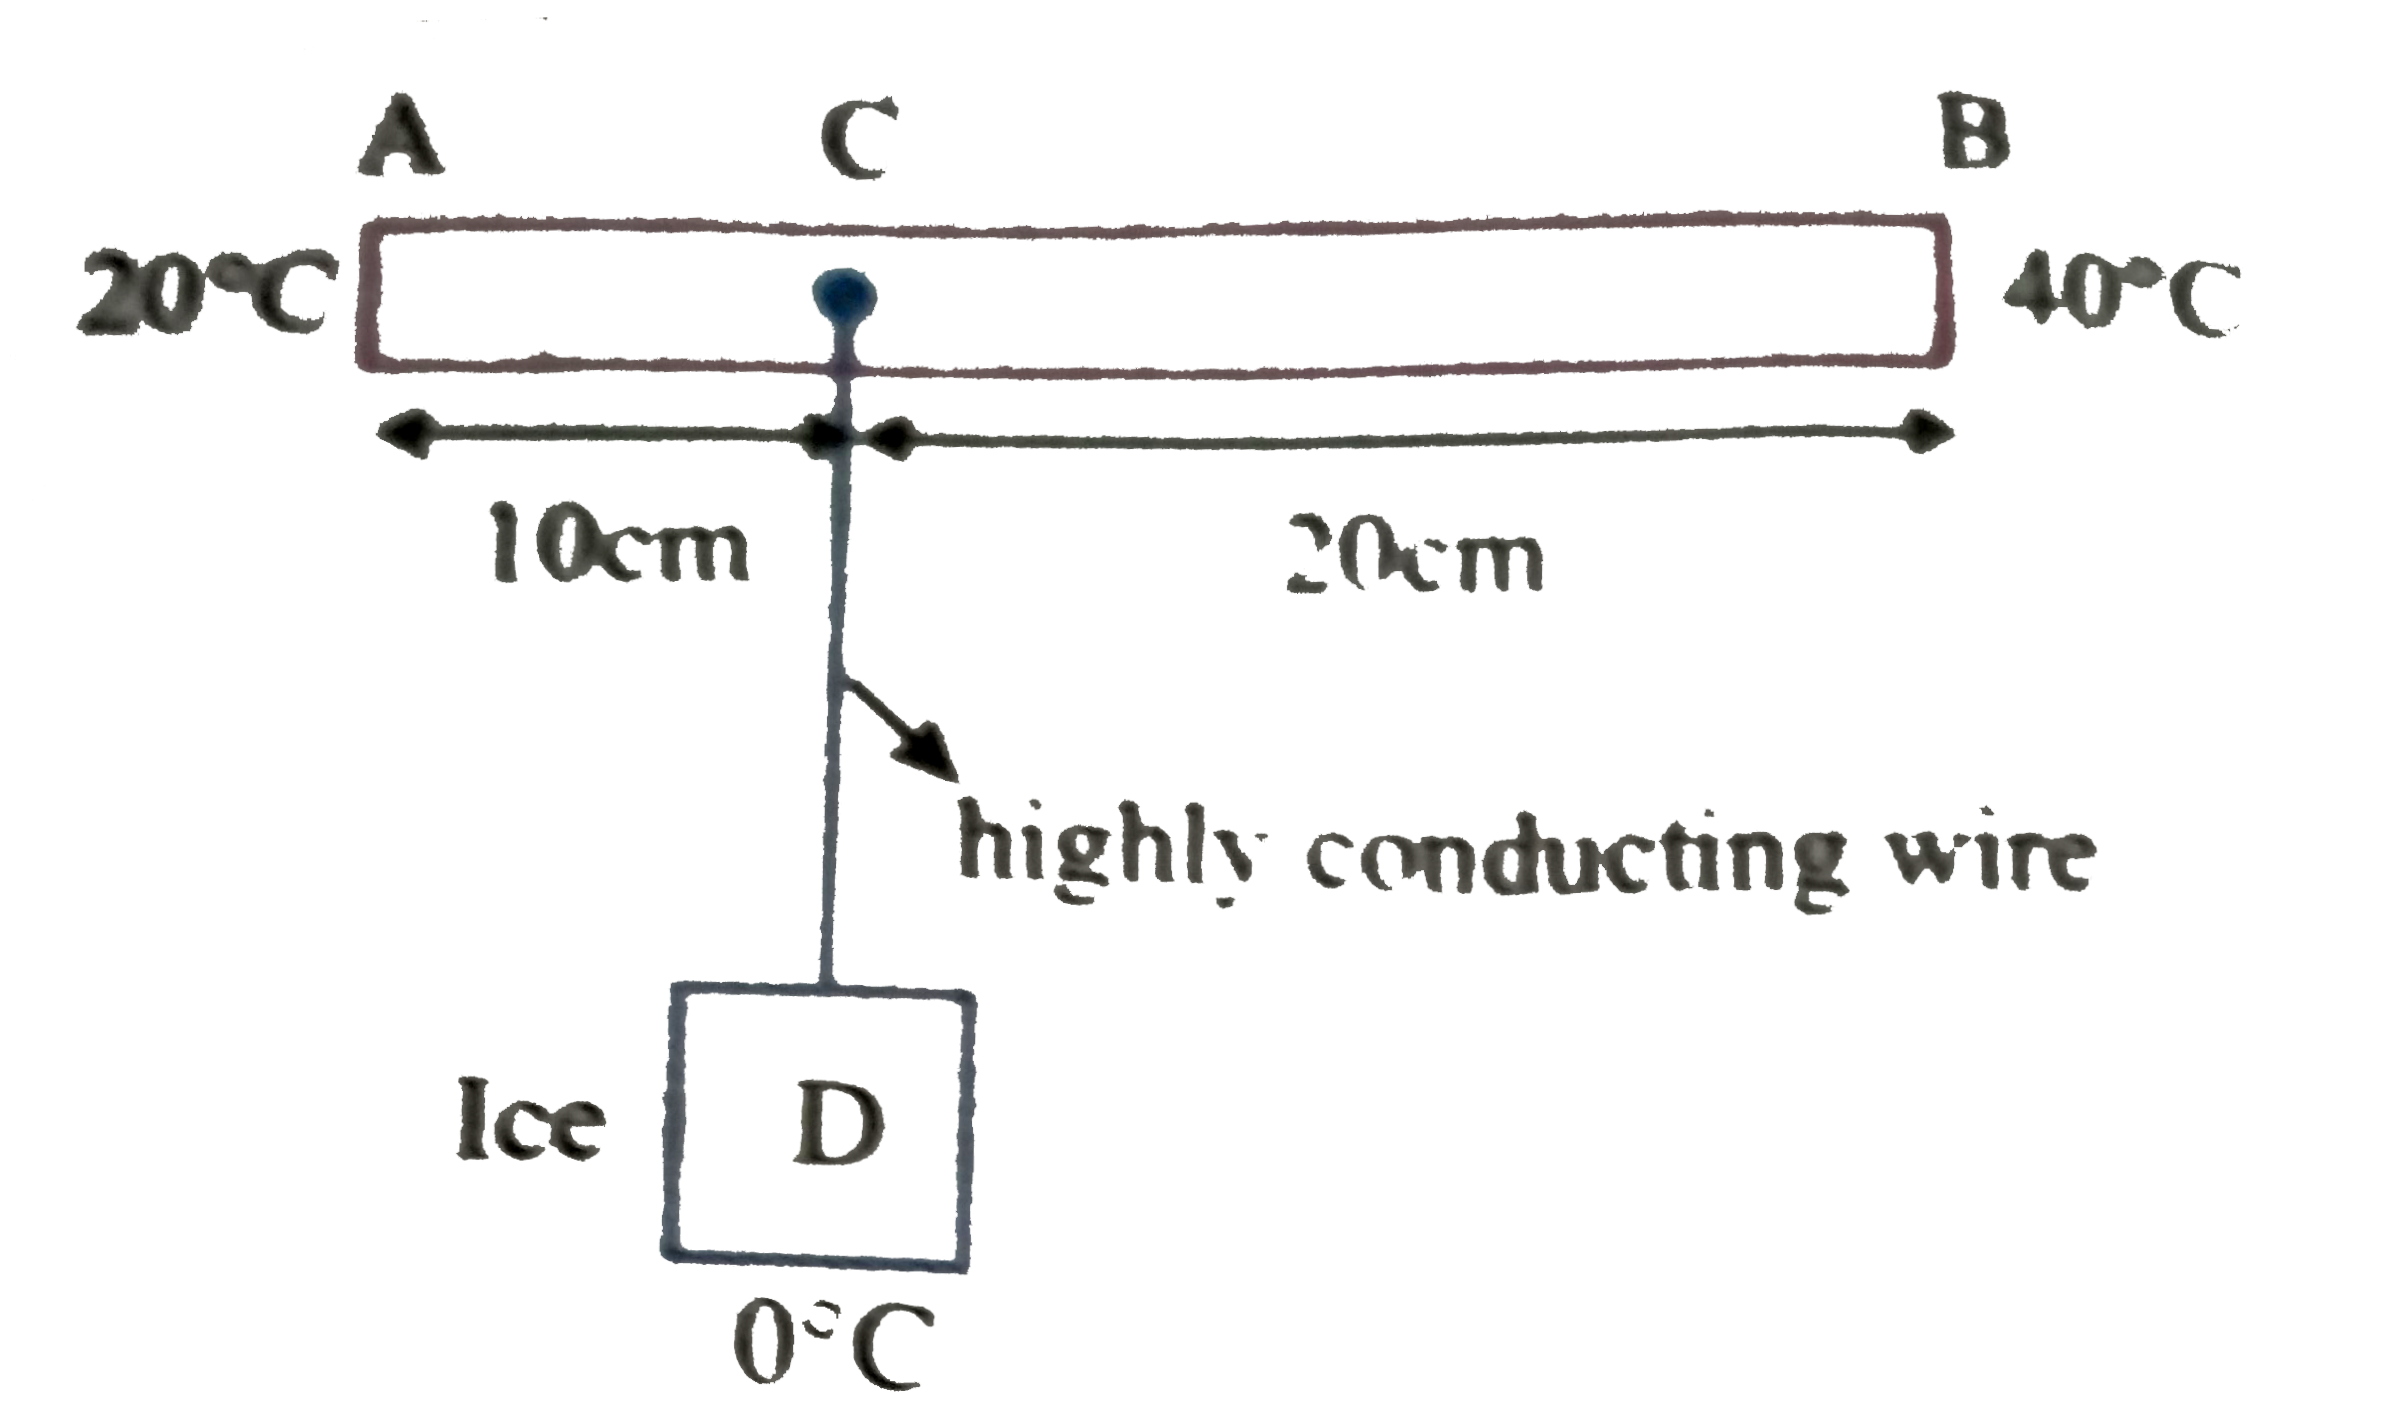
- As shown in Fig. AB is rod of length 30 cm and area of cross section 1...
Text Solution
|
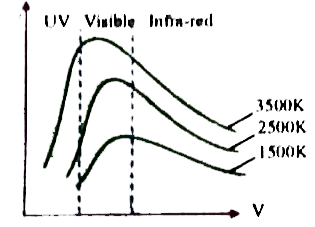
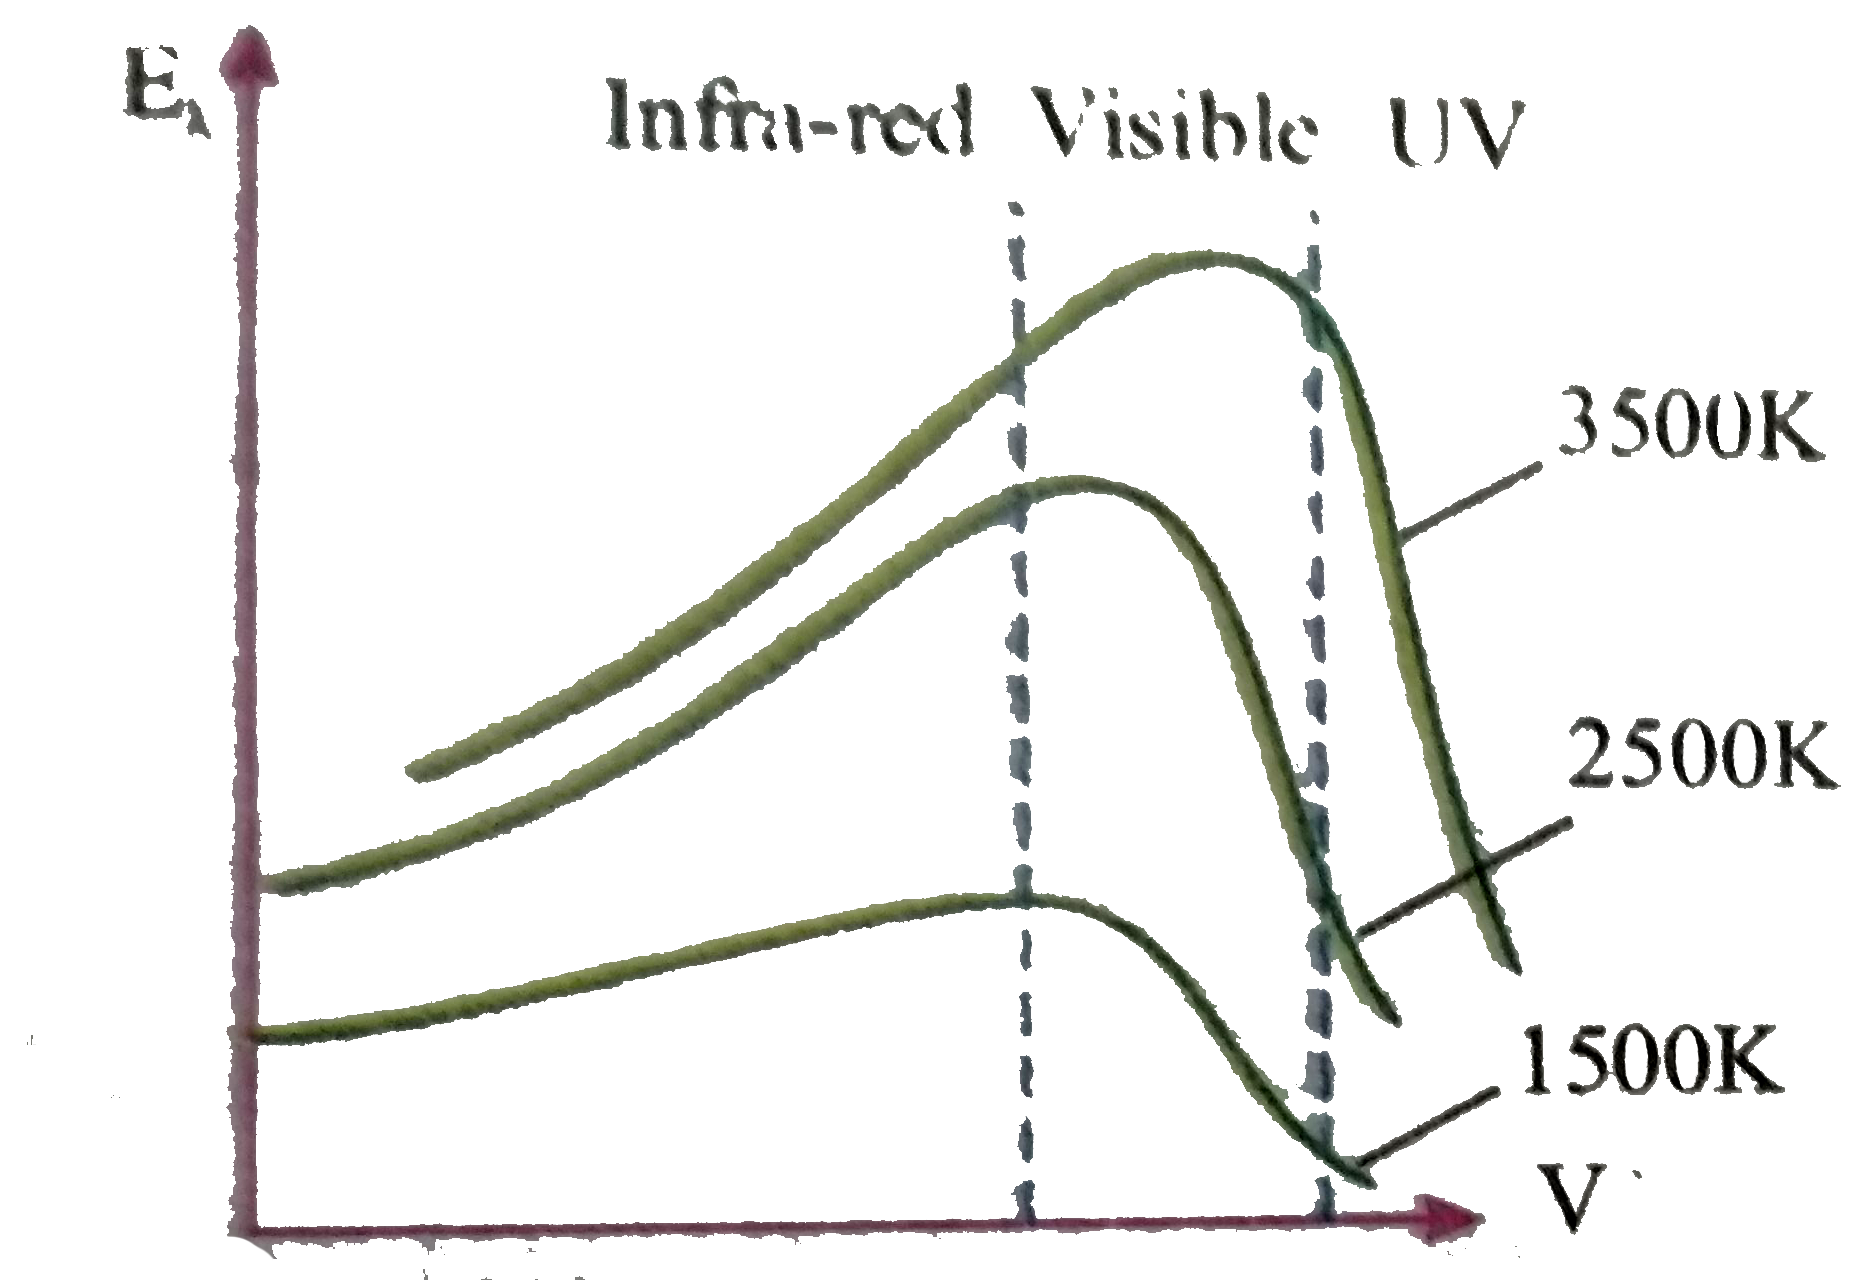
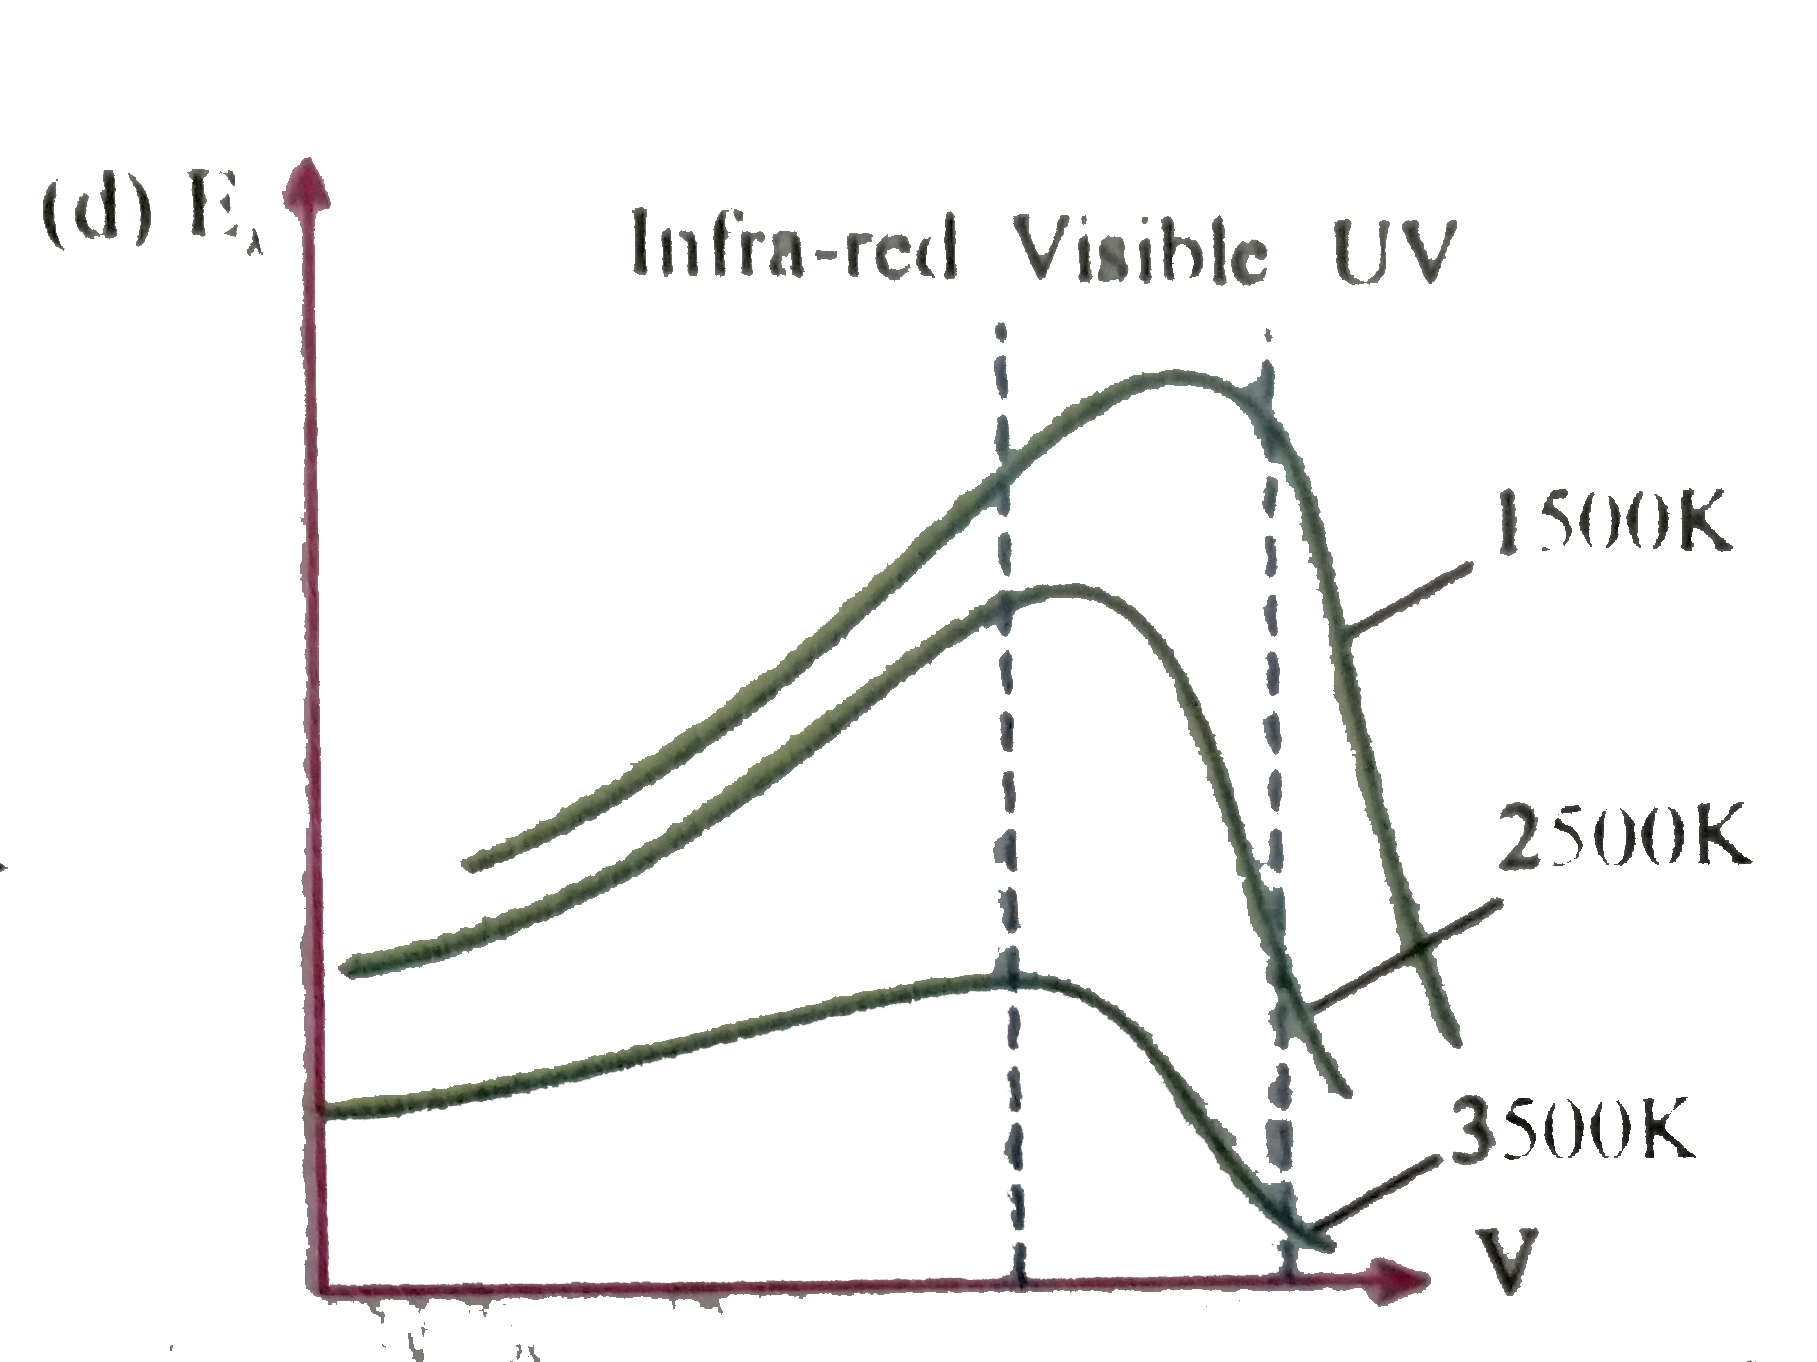
- Which of the following graphs shows the correct variation in intensity...
Text Solution
|
- Three different arrangemnets of matrials 1 and 2,3 to from a wall Thre...
Text Solution
|
- The figure shows a system of two concentric spheres of radii r1 and r2...
Text Solution
|
- Two identical objects A and B are at temperatures TA and TB. Respectiv...
Text Solution
|
- Two solid spheres are heated to the same temperature allowed to cool u...
Text Solution
|
- Two bodies A and B have thermal emissivities of 0.01 and 0.81 respecti...
Text Solution
|
- A 100 cm long cylindrical flask with inner and outer diameter 2 cm and...
Text Solution
|
- A metal cylinder of mass 0.5kg is heated electrically by a 12 W heater...
Text Solution
|
- When we consider convection with radiation in Newton's law of cooling ...
Text Solution
|
- An incandesent bulb has a thin filament of tungsten that is heated to ...
Text Solution
|
- A spherical black body of radius r radiated power P at temperature T w...
Text Solution
|
- The total energy of a blackbody radiation source is collected for one ...
Text Solution
|
- A body is kept inside a container the temperature of the body is T(1) ...
Text Solution
|
- A body is kept inside a container the temperature of the body is T(1) ...
Text Solution
|
- A body is kept inside a container the temperature of the body is T(1) ...
Text Solution
|
- Two rods A and B of same cross sectional are A and length l connected ...
Text Solution
|
- Two rods A and B of same cross sectional are A and length l connected ...
Text Solution
|
- The shows a radiant energy spectrum graph for a black body at at tempe...
Text Solution
|