


Similar Questions
Explore conceptually related problems
Recommended Questions
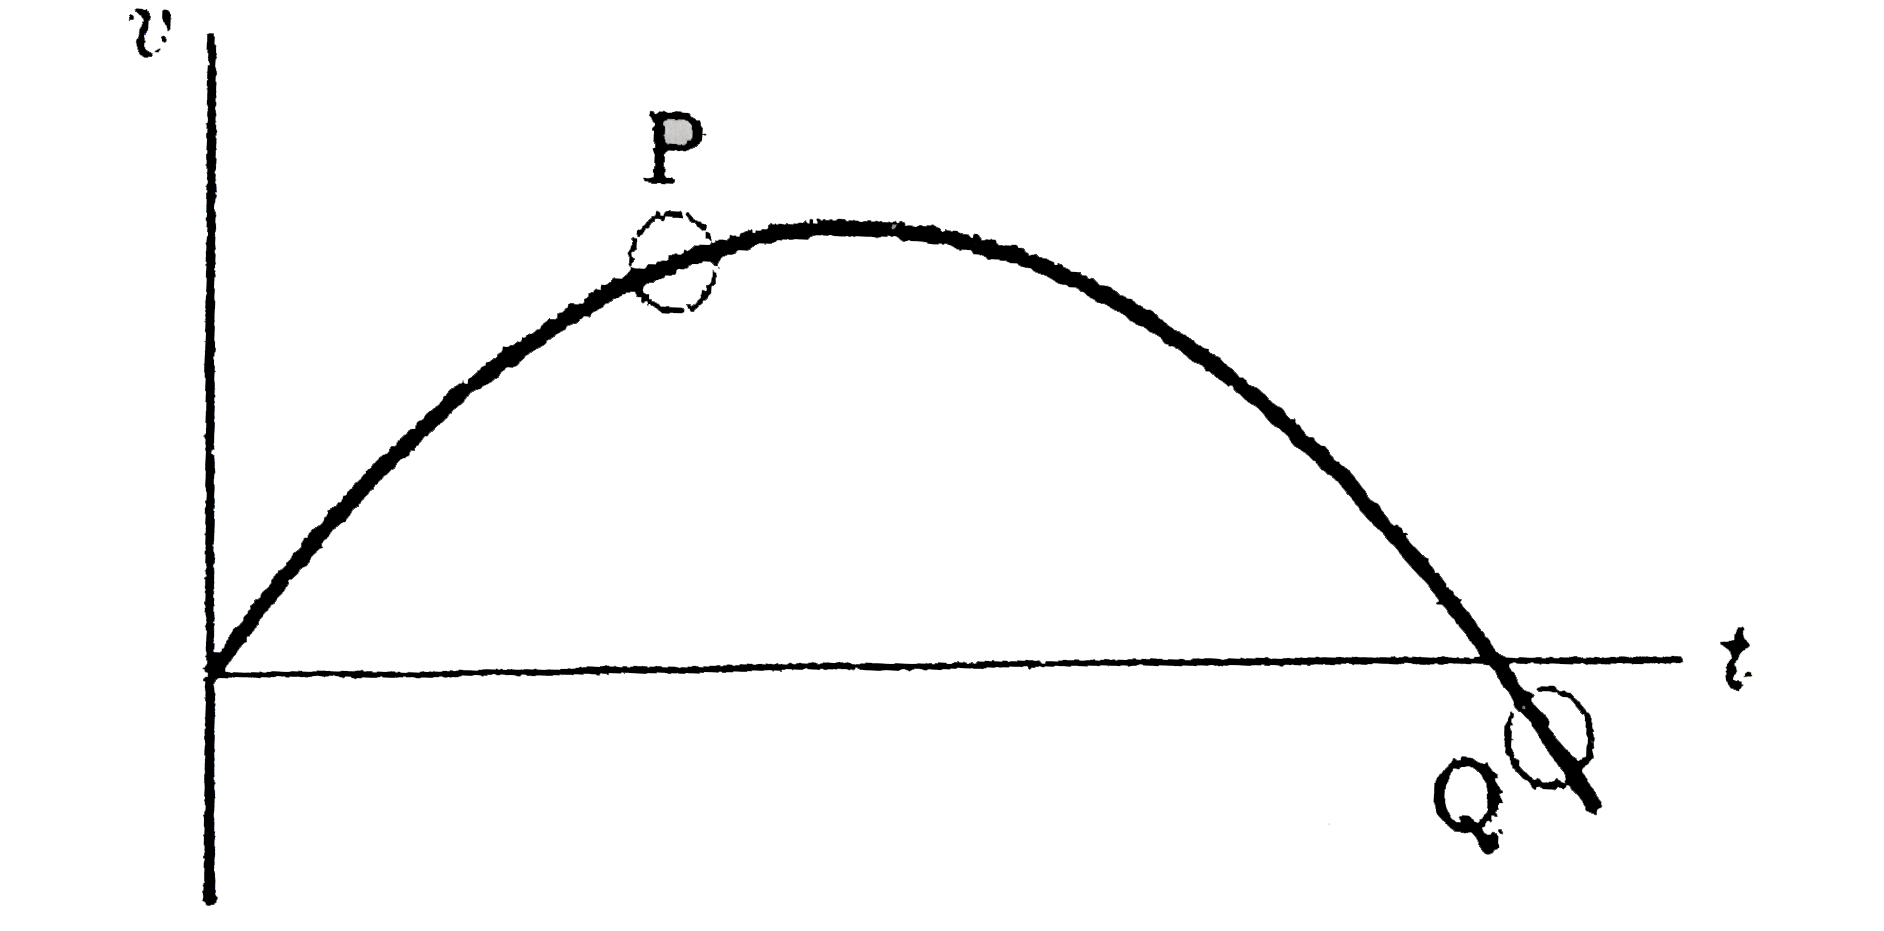
- The diagram shows a velocity-time graph for a car moving in a straight...
Text Solution
|
- The velocity-time graph of a car moving along a straight road is shown...
Text Solution
|
- The diagram shows a velocity-time graph for a car moving in a straight...
Text Solution
|
- A car is moving on a straight road. The velocity of the car varies wit...
Text Solution
|
- The velocity- time graph of car moving on a straight track is given be...
Text Solution
|
- The velocity- time graph of car moving on a straight track is given be...
Text Solution
|
- The velocity-time graph of a car moving along a straight road is shown...
Text Solution
|
- चित्र 3.40 में सीधी रेखा में गतिशील कार स्थिति - समय ग्राफ प्रदर्शित ह...
Text Solution
|
- चित्र 3.40 में सीधी रेखा में गतिशील कार स्थिति - समय ग्राफ प्रदर्शित ह...
Text Solution
|