A
B
C
D
Text Solution
Verified by Experts
The correct Answer is:


Topper's Solved these Questions
Similar Questions
Explore conceptually related problems
MARVEL PUBLICATION-ELASTICITY-Test Your Grasp - 5
- Out of the following materials, whose elasticity is independent of tem...
Text Solution
|
- Elasitcity of a meterial can not be changed
Text Solution
|
- A tangential force of 0.25 N is applied to a 5 cm cube to displace its...
Text Solution
|
- What would be the greatest length of a steel wire, which when fixed at...
Text Solution
|
- For steel, the breaking stress is 8 xx 10^(6) N//m^(2). What is the ma...
Text Solution
|
- Young's modulus of a wire is 2 xx 10^(11) N//m^(2). The wire is stretc...
Text Solution
|
- The bulk modulus of a metal is 8 xx 10^(9) N//m^(2). The pressure requ...
Text Solution
|
- A steel wire of length 1m, and radius 0.1mm is elongated by 1mm due to...
Text Solution
|
- A copper wire of length 3m and diameter 1mm is stretched to increase i...
Text Solution
|
- The Young's modulus of a wire of length 2m and area of cross section 1...
Text Solution
|
- A wire having Young's modulus 2 xx 10^(11)N//m^(2) is stretched by a f...
Text Solution
|
- An elastic spring of unstretched length L and spring constant K is str...
Text Solution
|
- A rectangular beam of metal supported at its two ends is loaded at the...
Text Solution
|
- A lift is tied with thick iron and its mass is 314 kg. What should be ...
Text Solution
|
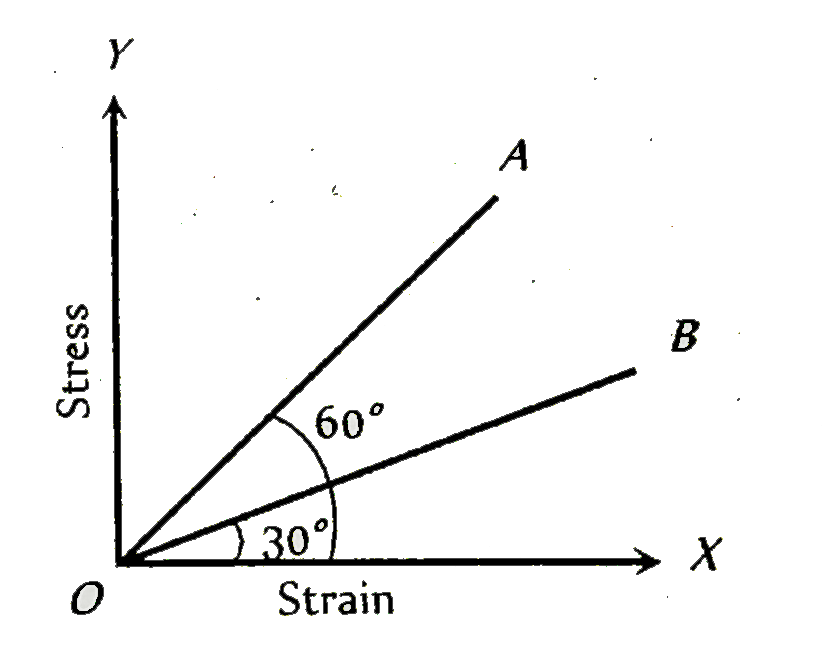
- The stress versus strain graphs for wires of two materials A and B are...
Text Solution
|