A

B

C
D

Text Solution
Verified by Experts


Topper's Solved these Questions
Similar Questions
Explore conceptually related problems
NIKITA PUBLICATION-CHEMICAL KINETICS -MCQs
- A zero order reaction is one whose rate is independent of
Text Solution
|
- The rate of a certain reaction at different time intervals are Th...
Text Solution
|
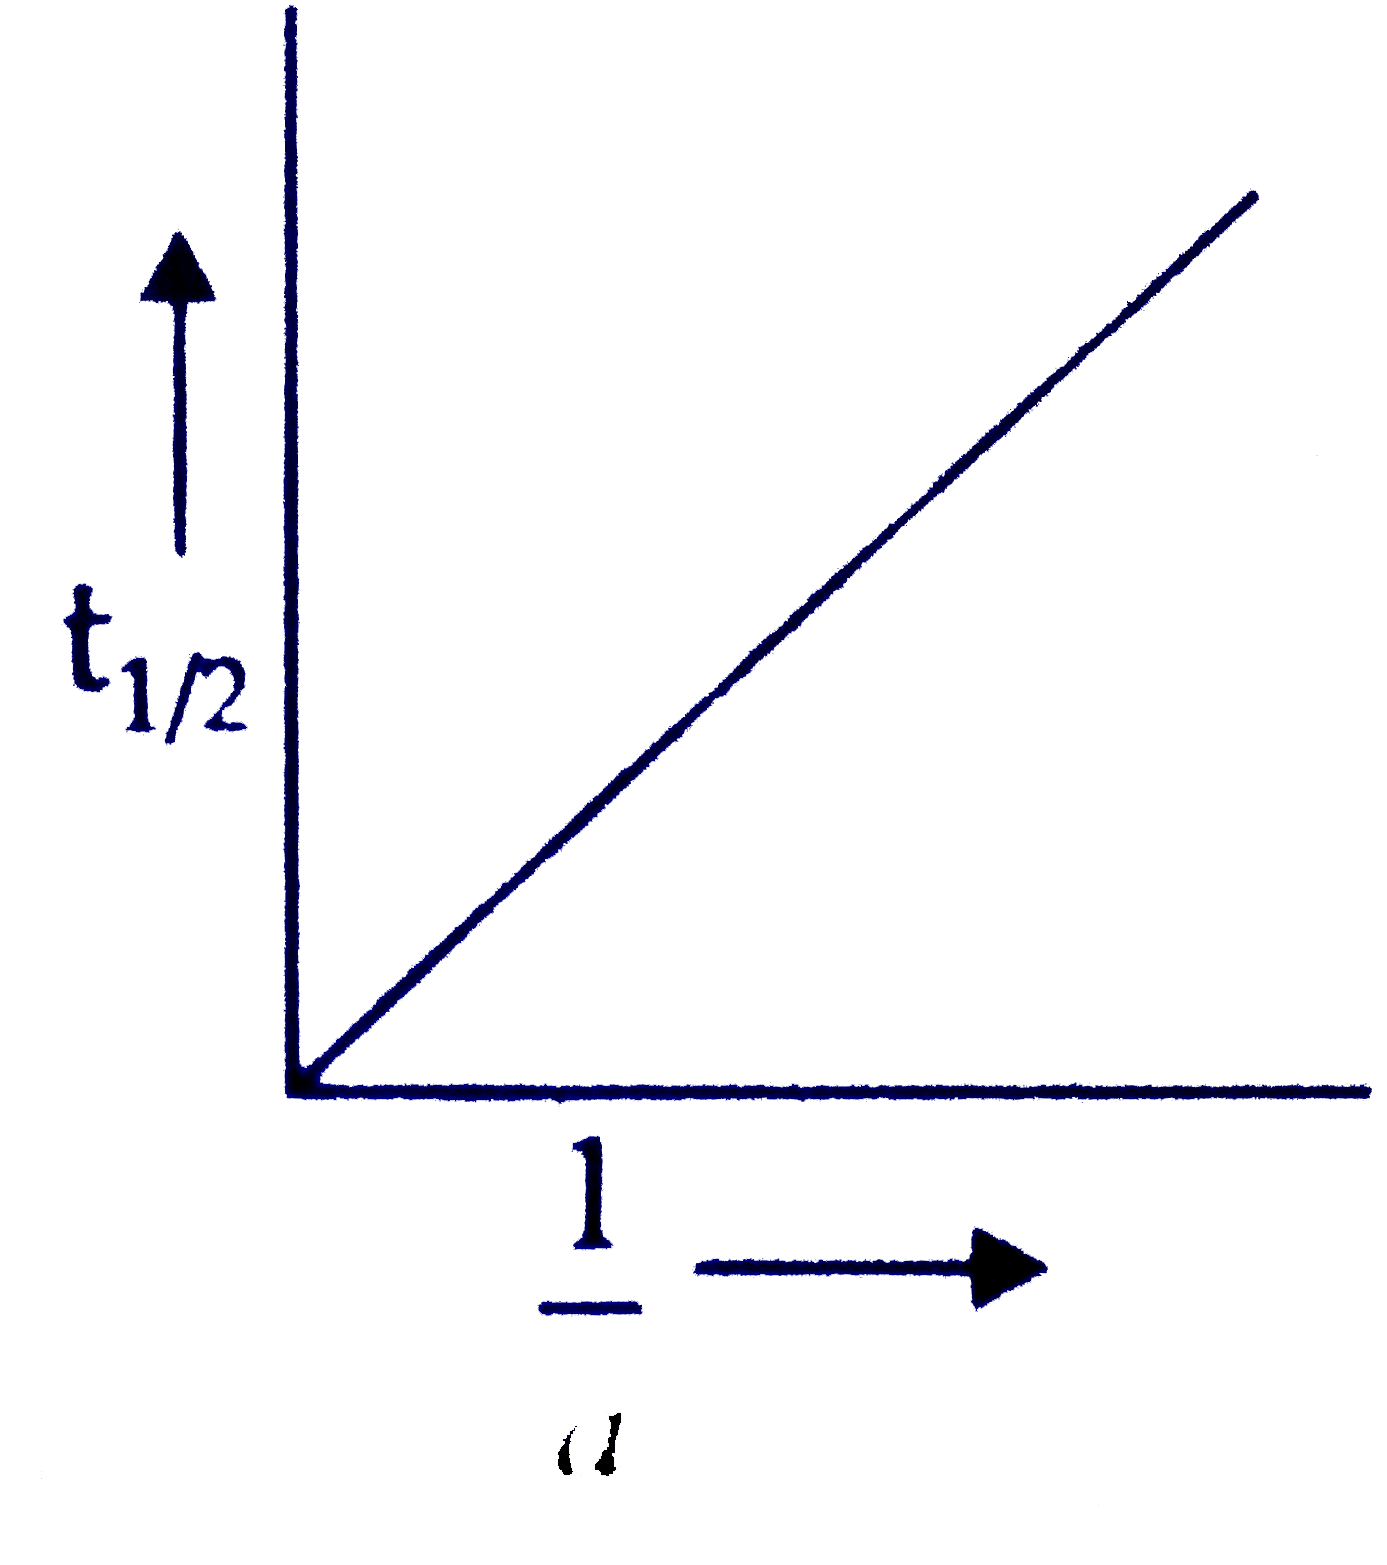
- Which of the following graphs formed plotted between t(1//2) and initi...
Text Solution
|
- Radioactive decay follows… order kinetics
Text Solution
|
- The decomposition of N2O5 occurs as, 2N2O5 to 4NO2 + O2, and follows ...
Text Solution
|
- Which one of the following formulae represents the first order reacti...
Text Solution
|
- For the first order reaction A to Products, which one of the following...
Text Solution
|
- For the first order gas phase decomposition reaction, A(g) to B(g) +...
Text Solution
|
- Which of the following is a first order reaction ?
Text Solution
|
- The accompanying figure depicts the change in concentration of species...
Text Solution
|
- The half-life for a reaction is ………. of temperature:
Text Solution
|
- The acid hydrolysis of ester is
Text Solution
|
- A reaction is a first order when
Text Solution
|
- The reaction CH3COOC2H5 + NaOH to CH3COONa+C2H5OH
Text Solution
|
- A substance with initial concentration 'a' follows zero order kinetics...
Text Solution
|
- The hydrolysis of ethyl acetat CH3COOC2H5+H2O overset(H^(+))to CH3CO...
Text Solution
|
- Which order of reaction obeys the relation t(1//2)=1//k ?
Text Solution
|
- A plot of log (a-x) against time 't' is a straight line. This indicate...
Text Solution
|
- For the half-life period of a first order reaction, which one of the f...
Text Solution
|
- A graph ploted between concetration of reaction consumed at any time (...
Text Solution
|