Home
Class 11
PHYSICS
The adjoining figure shows graphs of pre...


The adjoining figure shows graphs of pressure and volume of a gas at two temperature `T_1` and `T_2` Which of the following inferences is correct?

A

`T_1 gt T_2`

B

`T_1=T_2`

C

`T_1 lt T_2`

D

none

Text Solution

Verified by Experts

The correct Answer is:
C


`n=(P_2V)/(RT_2)=(P_1V)/(RT_1)`
`(P_2)/(T_2)=(P_1)/(T_1)`
Since `P_2 gt P_1`, hence, `T_2 gt T_1`
Promotional Banner

Topper's Solved these Questions

  • LAWS OF THERMODYNAMICS

    CP SINGH|Exercise EXERCISE|131 Videos
  • KINETIC THEORY OF GASES

    CP SINGH|Exercise Exercises|79 Videos
  • MOTION IN A PLANE

    CP SINGH|Exercise Exercises|69 Videos

Similar Questions

Explore conceptually related problems

The adjoining fgure shows graph of pressure and volume of a gas at two temperatures T_(1) and T_(2) Which one the following is correct

Figure shows graphs of pressure vs density for an ideal gas at two temperature T_(1) and T_(2) . Which of the following is correct?

Figure shows graphs of pressure vs density for an ideal gas at two temperature T_(1) and T_(2) . Which of the following is correct ?

Figure shows graphs of pressure versus density for an ideal gas at two temperatures T_1 and T_2 Then

Figure shows graphs of pressure vs density for an ideal gas at two temperatures T_(t) and T_(2)

show graphs of pressure vs density for an ideal gas at two temperatures T_(1)andT_(2)

Figure shows the pressure P versus volume V graphs for a certains mass of a gas at two constant temperature T_(1) and T_(2) . Which of the following interface is correct?

Figure shows graphs of pressure versus density for an ideal gas at two temperatures T_(1) and T_(2) Which is correct ? .

For the following graph, drawn from two different samples of gases at two different temperatures T_(1) and T_(2) , which of the following statements is/are necessarily true?

CP SINGH-LAWS OF THERMODYNAMICS-EXERCISE
  1. A pressure P, absolute temperature T, graph was obtained whe a given m...

    Text Solution

    |

  2. A volume V absolute temperature T diagram was obtained when a given ma...

    Text Solution

    |

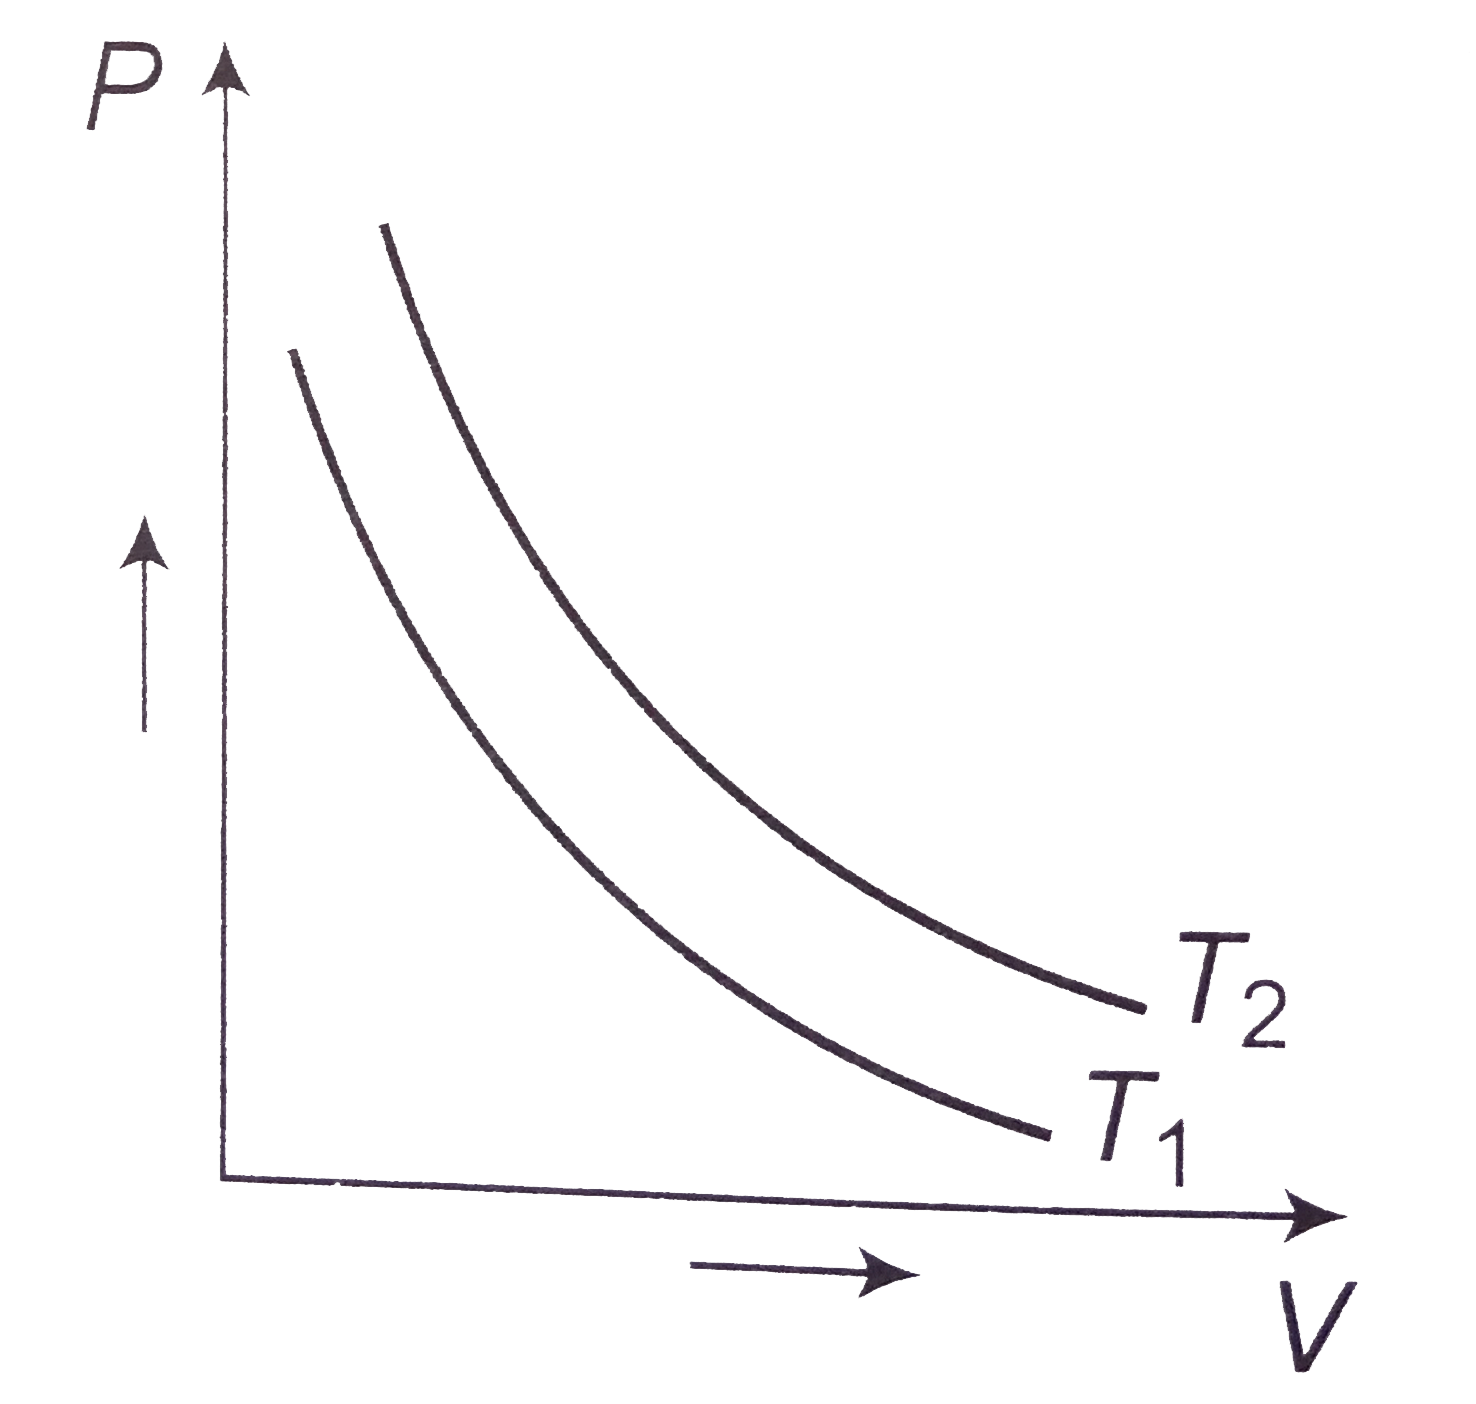
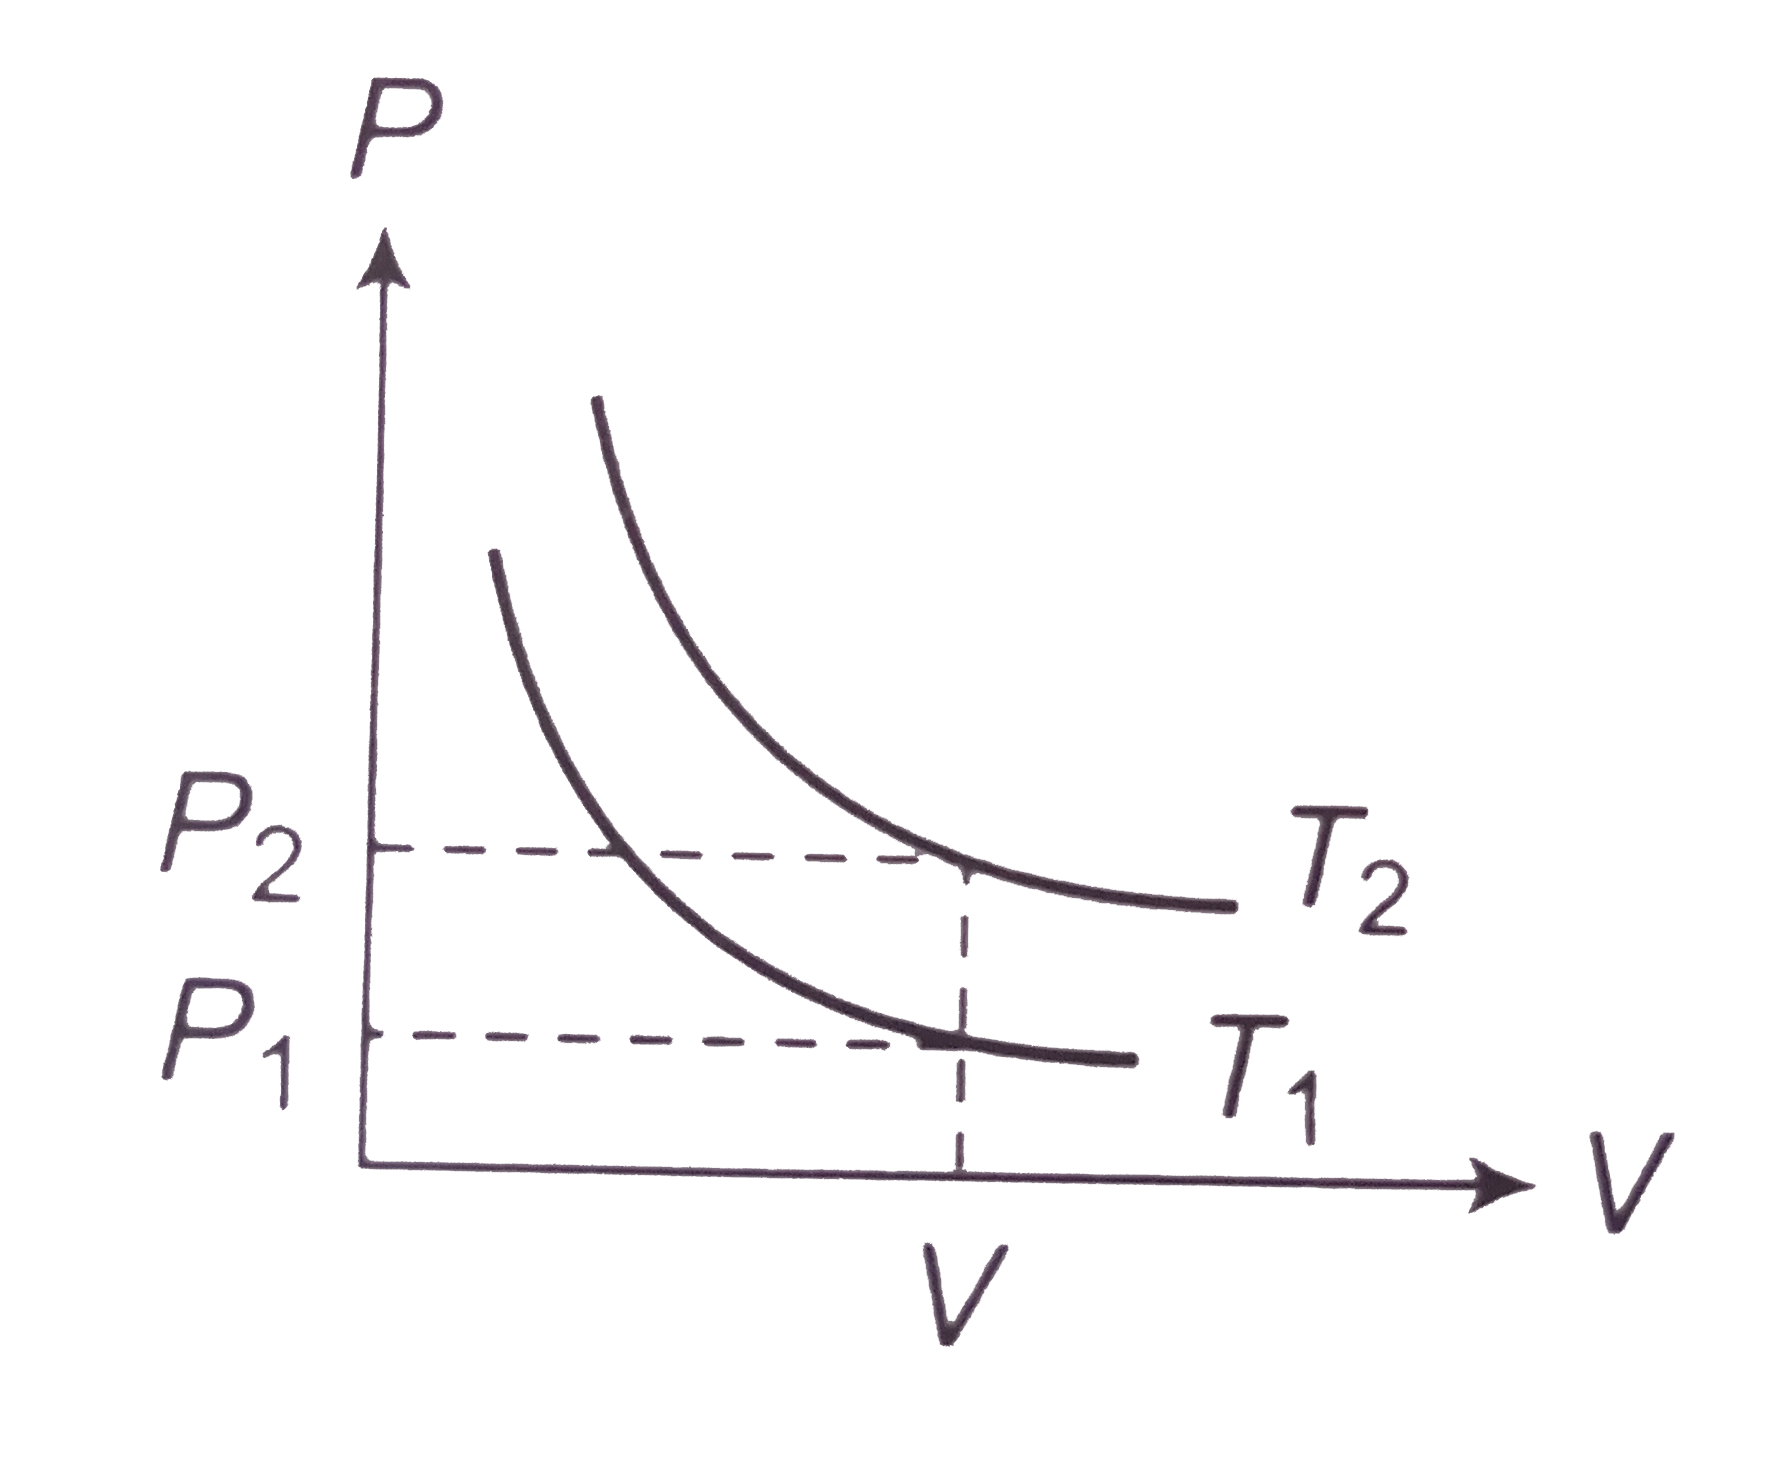
  3. The adjoining figure shows graphs of pressure and volume of a gas at t...

    Text Solution

    |

  4. P-V graph was obtained from state 1 to state 2 when a given mass of a ...

    Text Solution

    |

  5. A gas expands such that its initial and final temperature are equal . ...

    Text Solution

    |

  6. An ideal gas is taken form the state A(P,V) to the state B((P)/(2),2V)...

    Text Solution

    |

  7. One mole of an ideal gas goes from an initial state A to final state B...

    Text Solution

    |

  8. One mole of an ideal gas in initial state A undergoes a cyclic process...

    Text Solution

    |

  9. Which of the following graphs correctly represents the variation of be...

    Text Solution

    |

  10. An ideal gas is initially at temperature T and volume V. Its volume is...

    Text Solution

    |

  11. Six moles of an ideal gas performs a cycle shown in figure, the temper...

    Text Solution

    |

  12. Assertion: The internal energy of an ideal gas does not change during ...

    Text Solution

    |

  13. For an isothermal expansion of a perfect gas, the value of (DeltaP)/(P...

    Text Solution

    |

  14. If heat is supplied to an ideal gas in an isothermal process.

    Text Solution

    |

  15. In an isothermal process on an ideal gas, the pressure increases by 0....

    Text Solution

    |

  16. The internal energy of a system remains constant when it undergoes (...

    Text Solution

    |

  17. When an ideal gas in a cylinder was compreswsed isothermally by a pist...

    Text Solution

    |

  18. During an isothermal expansion, a confined ideal gas does -150 J of wo...

    Text Solution

    |

  19. A cyclic process is shown in the P-T siagram. Whech of the curves show...

    Text Solution

    |

  20. A cyclic process ABCD is shown is shown in the following P-V diagram. ...

    Text Solution

    |