Home
Class 12
PHYSICS
The rate of decay (R ) of nuclei in a ra...

The rate of decay `(R )` of nuclei in a radioactive sample is plotted against time `(t)`. Which of the following best represents the resulting curve ?

A

B

C

D

Text Solution

Verified by Experts

The correct Answer is:
A
Promotional Banner

Topper's Solved these Questions

  • NUCLEAR PHYSICS

    NARAYNA|Exercise Level-V questions(Single answer type questions)|12 Videos
  • NUCLEAR PHYSICS

    NARAYNA|Exercise Level-V Multiple answer questions|45 Videos
  • NUCLEAR PHYSICS

    NARAYNA|Exercise Level-II (C.W)|14 Videos
  • MOVING CHARGES AND MAGNETISM

    NARAYNA|Exercise EXERCISE - 4|20 Videos
  • NUCLEI

    NARAYNA|Exercise ASSERTION & REASON|5 Videos

Similar Questions

Explore conceptually related problems

A piece of cork starts from rest at the bottom of a lake and floats up. Its velocity v is plotted against time t. Which of the following best represents the resulting curve?

An ideal cell is connected to a capacitor through a voltmeter. The reading V of the voltmeter is plotted agains time. Which of the following best represents the resulting curve?

A square, conducting loop falls from rest in the xy-plane. There is a uniform magnetic field in the z-direction below the x-axis. The velocity v of the loop is plotted against time t. Which of the following best represents the resulting curve

A thin, straight conductor lies along the axis of a hollow conductor of radius R . The two carry equal currents in the same direction. The magnetic field B is plotted against the distance r from the axis. Which of the following best represents the resulting curve?

An inductor and a capacitor are joined in series to an AC source. The frequency of the AC is gradually increased. The phase difference varphi between the emf and the current is plotted against nthe angular frequency omega . Which of the following best represents the resulting curve?

In an LR circuit connected to a battery, the rate at which energy is stored in the inductor is plotted against time during the growth of current in the circuit. Which of the following best represents the resulation curve?

The variation of decay rate of two radioactive samples A and B with time is shown in fig. Which of the following statements are true?

When an electric heater is switched on, the current flowing through it ( i ) is plotted against time ( t ). Taking into account the variation of resistance with temperature, which of the following best represents the resulting curve

A solid sphere of radius R is charged uniformly. The electrostatic potential V is plotted as a function of distance r from the centre of th sphere. Which of the following best represents the resulting curve?

NARAYNA-NUCLEAR PHYSICS-Level-III
  1. A radioactive sample has a mass m, decay cosntant lambda, and molecul...

    Text Solution

    |

  2. In moon rock sample the ratio of the number of stable argon-40 atoms p...

    Text Solution

    |

  3. The half-life of a radioactive sample is T. If the activities of the s...

    Text Solution

    |

  4. Consider a hypothetical annihilation of a stationary electron with a s...

    Text Solution

    |

  5. A radioactive nucleus can decay by two different processes. The half l...

    Text Solution

    |

  6. A proton with kinetic energy K, strikes another proton at rest. If the...

    Text Solution

    |

  7. The fraction quantity of a radiactive sample will decay during half of...

    Text Solution

    |

  8. A small quantity of a solution containing N^(24) radio-nuclide of hal...

    Text Solution

    |

  9. A nucleus with mass number 220 initially at rest emits an alpha-partic...

    Text Solution

    |

  10. Some amount of a radioactice substance (half-life =10 days ) is spread...

    Text Solution

    |

  11. In the options given below, let E denote the rest mass energy of a nuc...

    Text Solution

    |

  12. Four different radioactive elements are kept in separated containers. ...

    Text Solution

    |

  13. Binding energy per nucleons vs mass curve for nucleus is shown in the ...

    Text Solution

    |

  14. When (3)Li^(7) nuclei are bombarded by protons , and the resultant nuc...

    Text Solution

    |

  15. A sample of uranium is a mixture of three isotopes .(92)U^(234), .(92)...

    Text Solution

    |

  16. The table that follows shows some measurementf of the decay rate of a ...

    Text Solution

    |

  17. The fraction f of radioactive material that has decayed in time t, var...

    Text Solution

    |

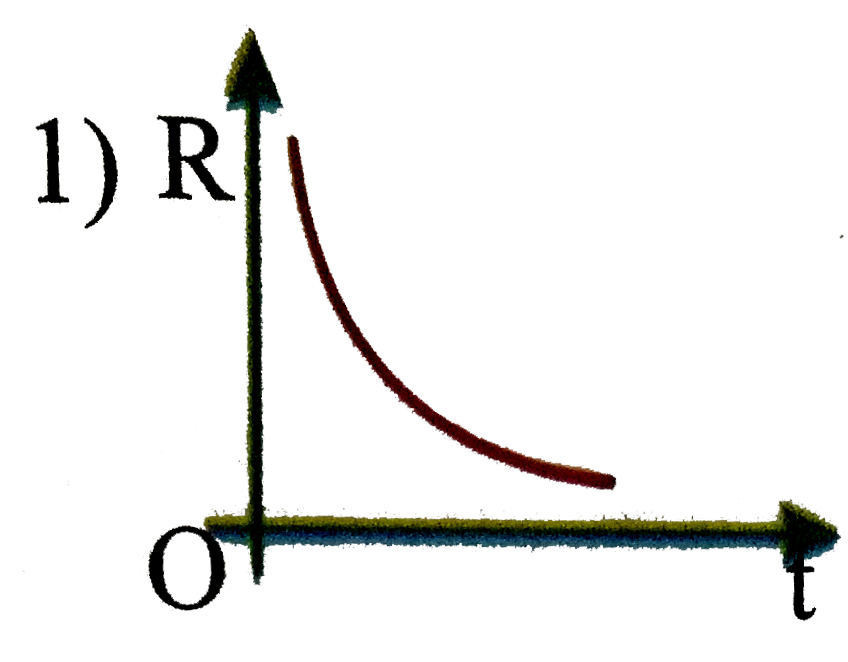
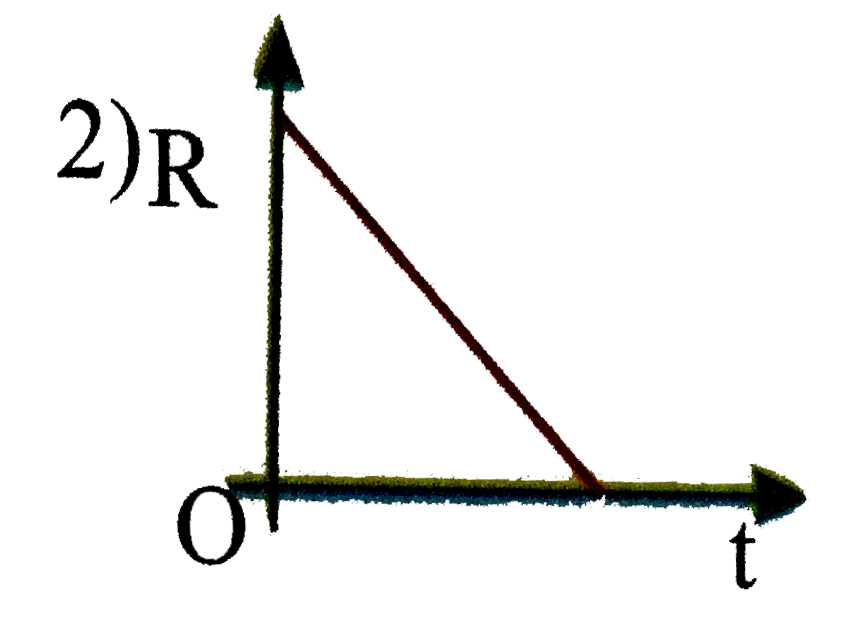
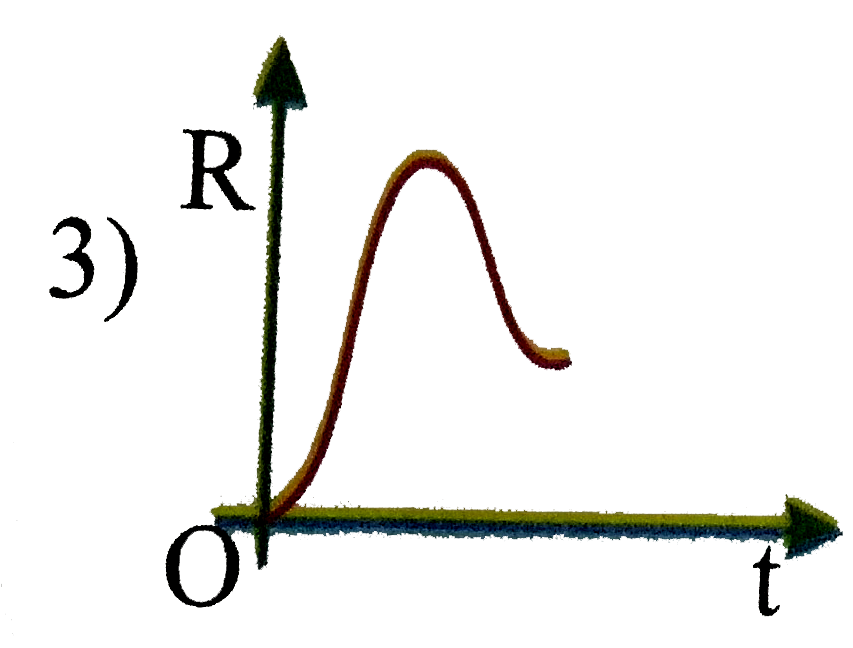
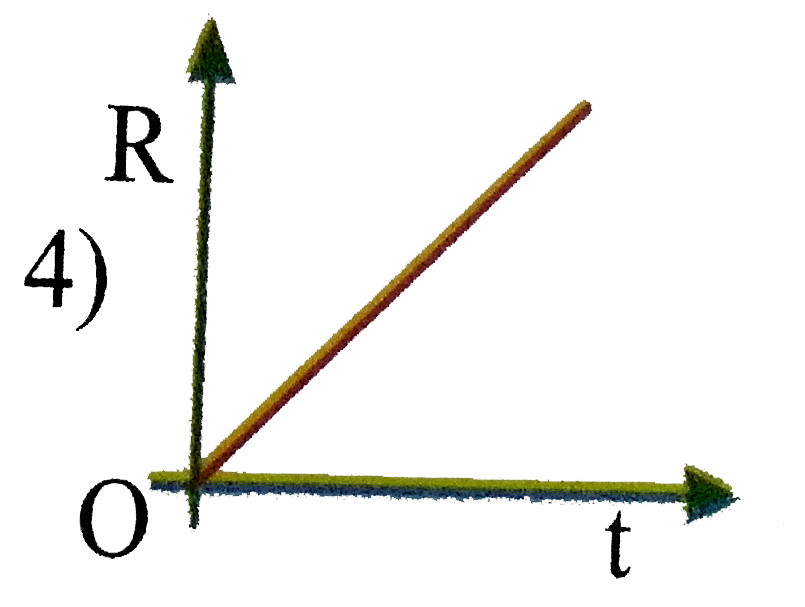
  18. The rate of decay (R ) of nuclei in a radioactive sample is plotted ag...

    Text Solution

    |

  19. What is the probability of a radioactive nucleus to survive one mean l...

    Text Solution

    |

  20. A radioactive isotope is being produced at a constant rate dN//dt=R in...

    Text Solution

    |