


Similar Questions
Explore conceptually related problems
Recommended Questions
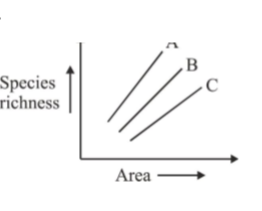
- In the above graph, which slope represents more species richness ?
Text Solution
|
- Relationship between species richness (S) and area (A) represent in th...
Text Solution
|
- कार्य-समय ग्राफ का ढलान क्या प्रदर्शित करता है?
Text Solution
|
- In the above graph, which slope represents more species richness ?
Text Solution
|
- The graph above could represent which of the following equations?
Text Solution
|
- Which function could represents the graph above?
Text Solution
|
- The slope of graph v tot represents ......
Text Solution
|
- The slope of potential energy versus position graph represents
Text Solution
|
- What does the slope of velocity-time graph represent ?
Text Solution
|