


Similar Questions
Explore conceptually related problems
Recommended Questions
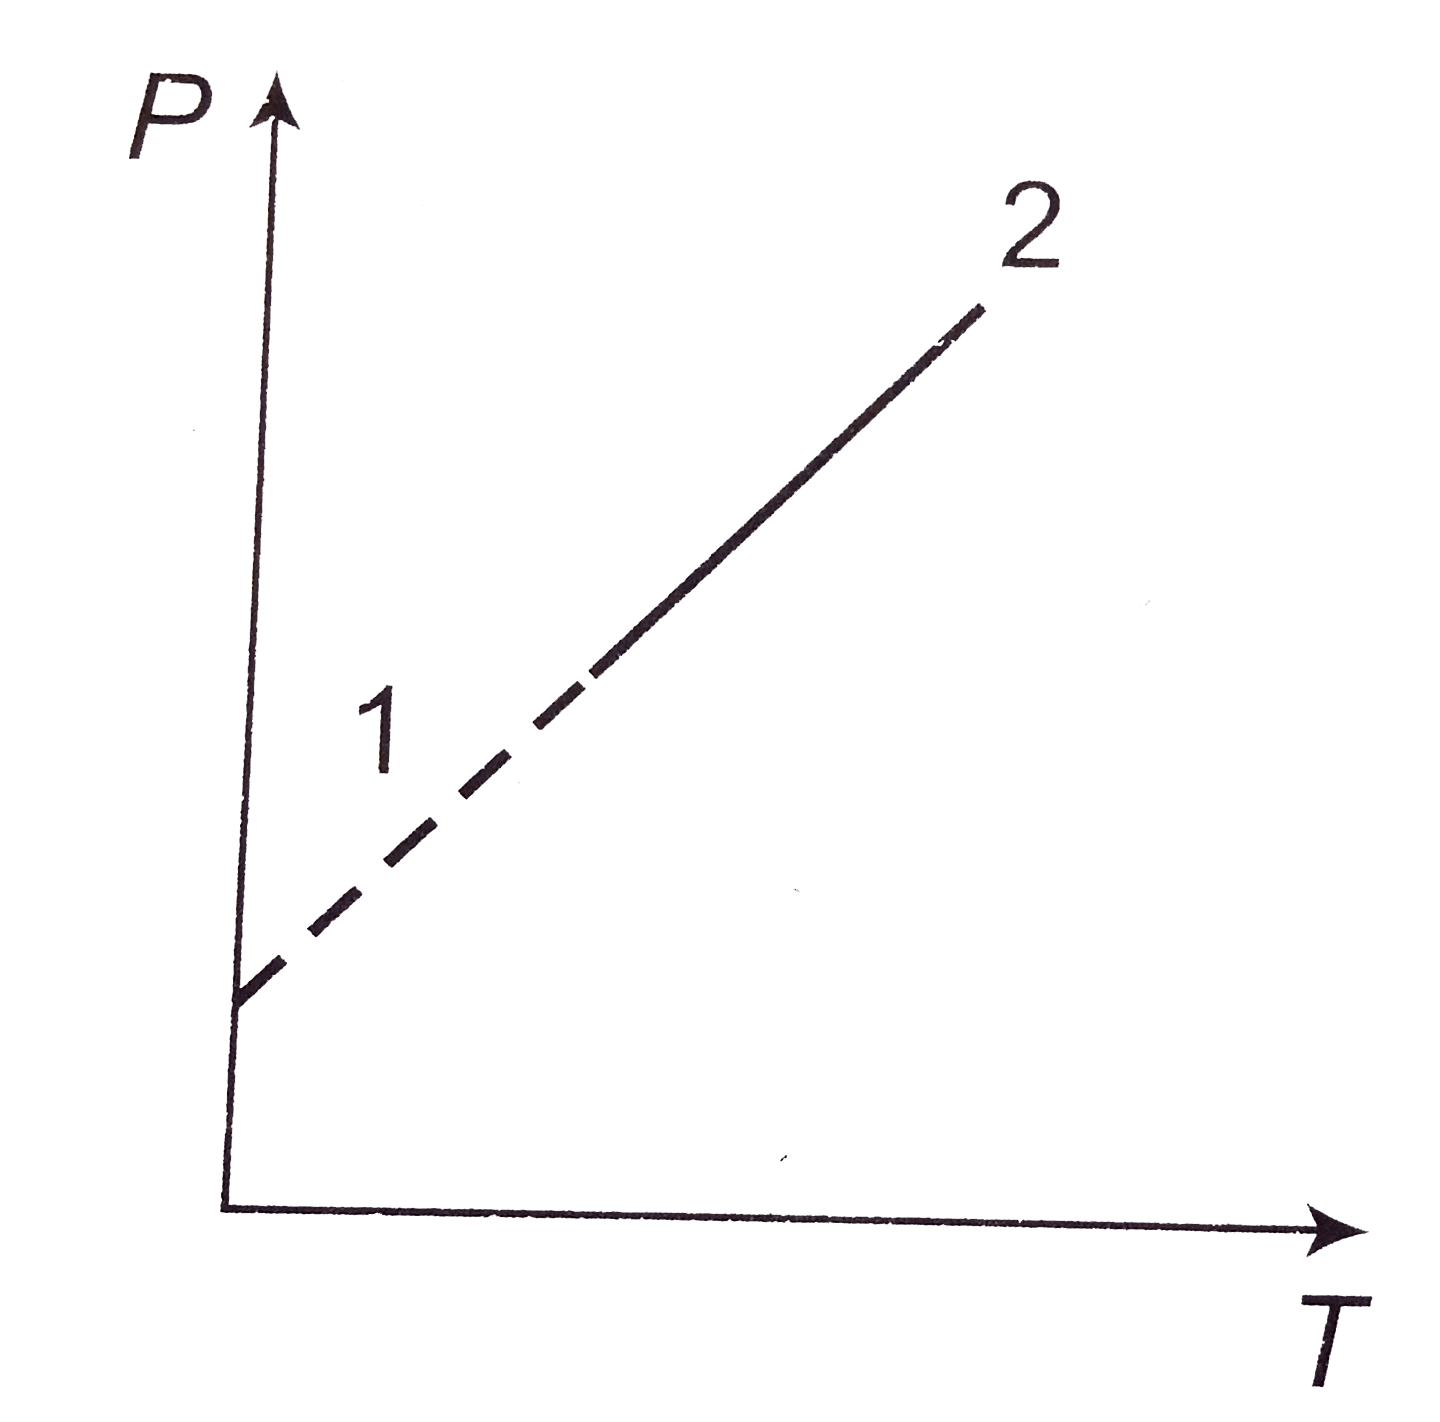
- A pressure P, absolute temperature T, graph was obtained whe a given m...
Text Solution
|
- Two different masses m and 3 m of an ideal gas are heated separately i...
Text Solution
|
- A pressure P, absolute temperature T, graph was obtained whe a given m...
Text Solution
|
- P-V graph was obtained from state 1 to state 2 when a given mass of a ...
Text Solution
|
- A volume V absolute temperature T diagram was obtained when a given ma...
Text Solution
|
- Four moles of an ideal gas is initially in a state A having pressure 2...
Text Solution
|
- मोल आदर्श गैस के व्यवहार को एक वायुमण्डलीय दाब पर प्रदर्शित किया गया ह...
Text Solution
|
- A volume V and temperature Twas obtained, as shown in diagram, when a ...
Text Solution
|
- आयतन V परमतापा T के बीच ग्राफ प्राप्त किया गया जब दिए गए द्रव्यमान की ...
Text Solution
|