


Similar Questions
Explore conceptually related problems
Recommended Questions
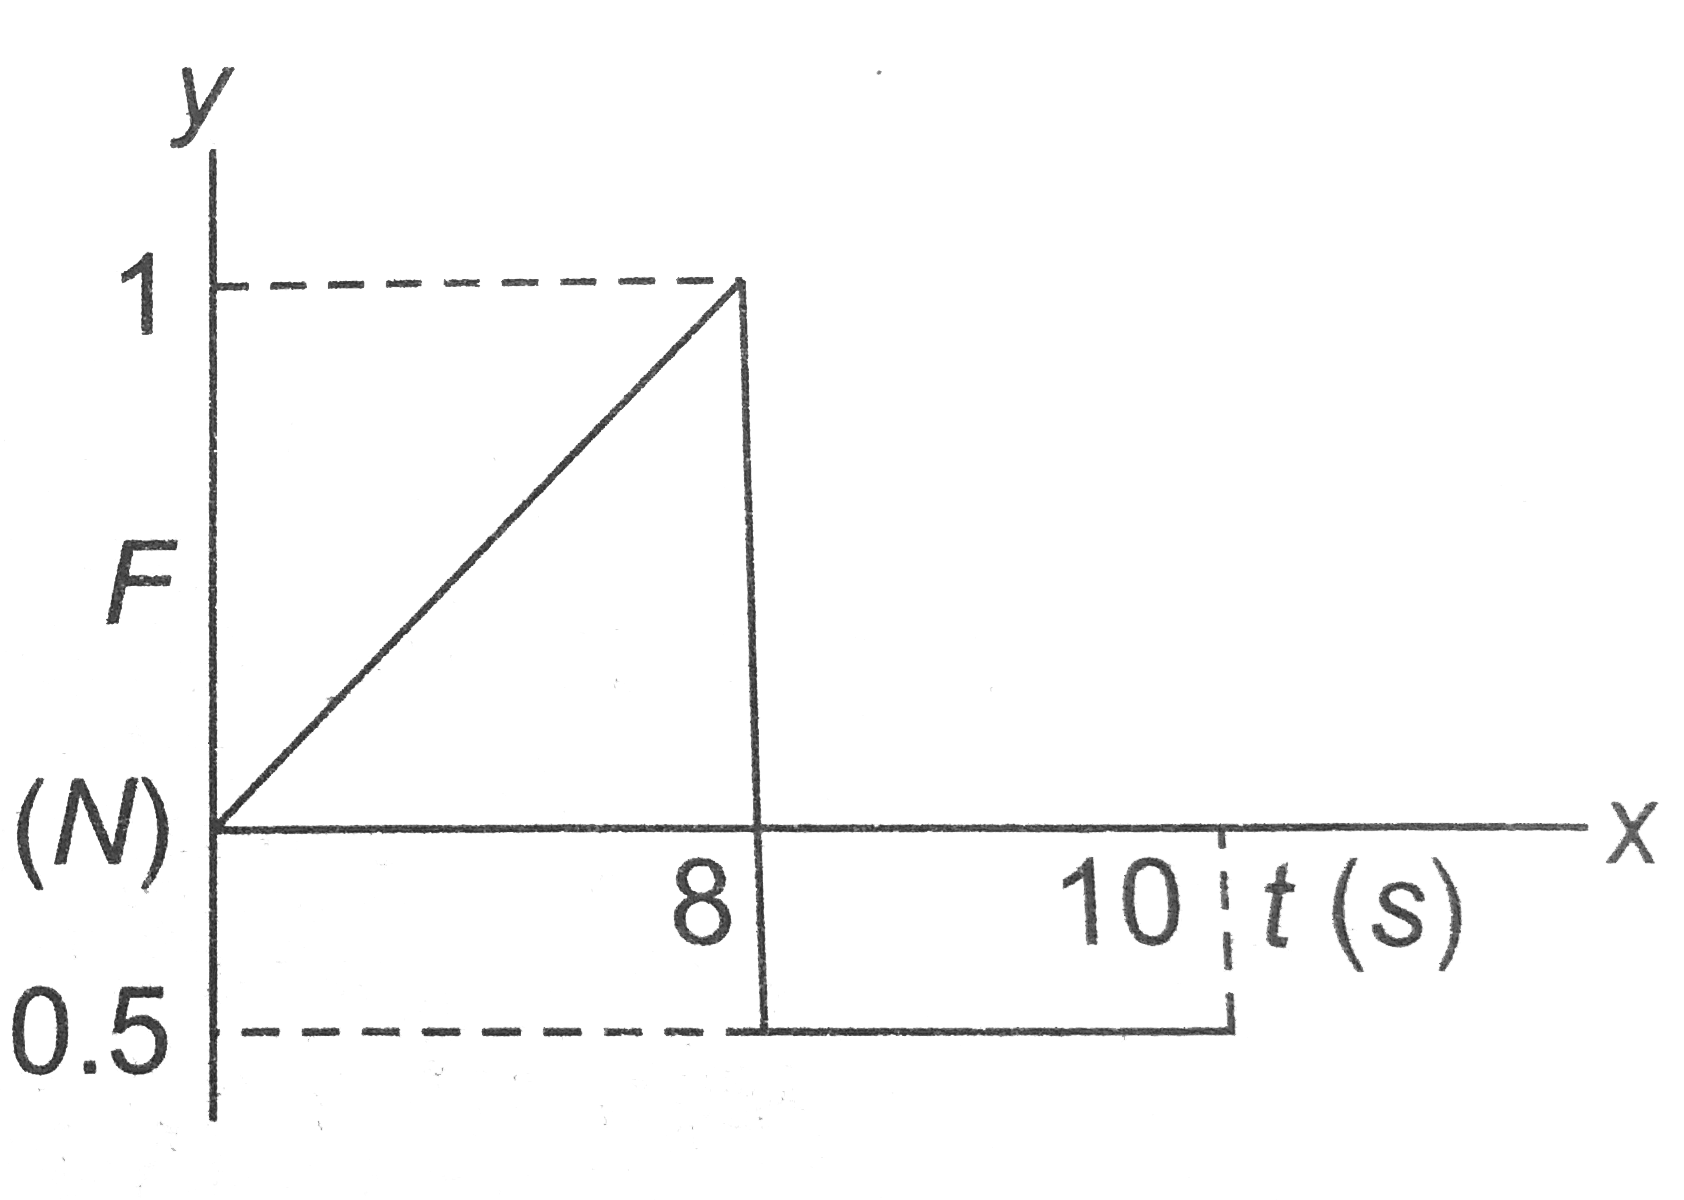
- A force-time graph for the motion of a body is shown in the figure. Th...
Text Solution
|
- The displacement-time graph of a body is shown in. . The velocity-...
Text Solution
|
- A body of 2kg has an initial speed 5ms^(-1) . A force acts on it for s...
Text Solution
|
- A force-time graph for the motion of a body is shown in the figure. Th...
Text Solution
|
- A force time graph for the motion of a body is as shown in Change in l...
Text Solution
|
- A force-time graph for the motion of a body is shown in fig. change in...
Text Solution
|
- A force-time graph for the motion of a body is shown in fig. Change in...
Text Solution
|
- A force time graph for the motion of a body is as shown in figure. Cha...
Text Solution
|
- A force-time graph for the motion of a body is shown in figure. Change...
Text Solution
|