A
B
C
D
Text Solution
Verified by Experts
The correct Answer is:


Topper's Solved these Questions
MOTION IN A STRAIGHT LINE
NARAYNA|Exercise Passage Type Questions|16 VideosMOTION IN A STRAIGHT LINE
NARAYNA|Exercise Multiple Answer Question|22 VideosMOTION IN A STRAIGHT LINE
NARAYNA|Exercise Single Type Question|23 VideosMOTION IN A PLANE
NARAYNA|Exercise Level-II(H.W)|31 VideosNEWTONS LAWS OF MOTION
NARAYNA|Exercise PASSAGE TYPE QUESTION|6 Videos
Similar Questions
Explore conceptually related problems
NARAYNA-MOTION IN A STRAIGHT LINE-More than One Option Question
- At a metro station, a girl walks up a stationary escalator in time t1 ...
Text Solution
|
- The variation of quantity A with quantity B is plotted in the fig. Des...
Text Solution
|
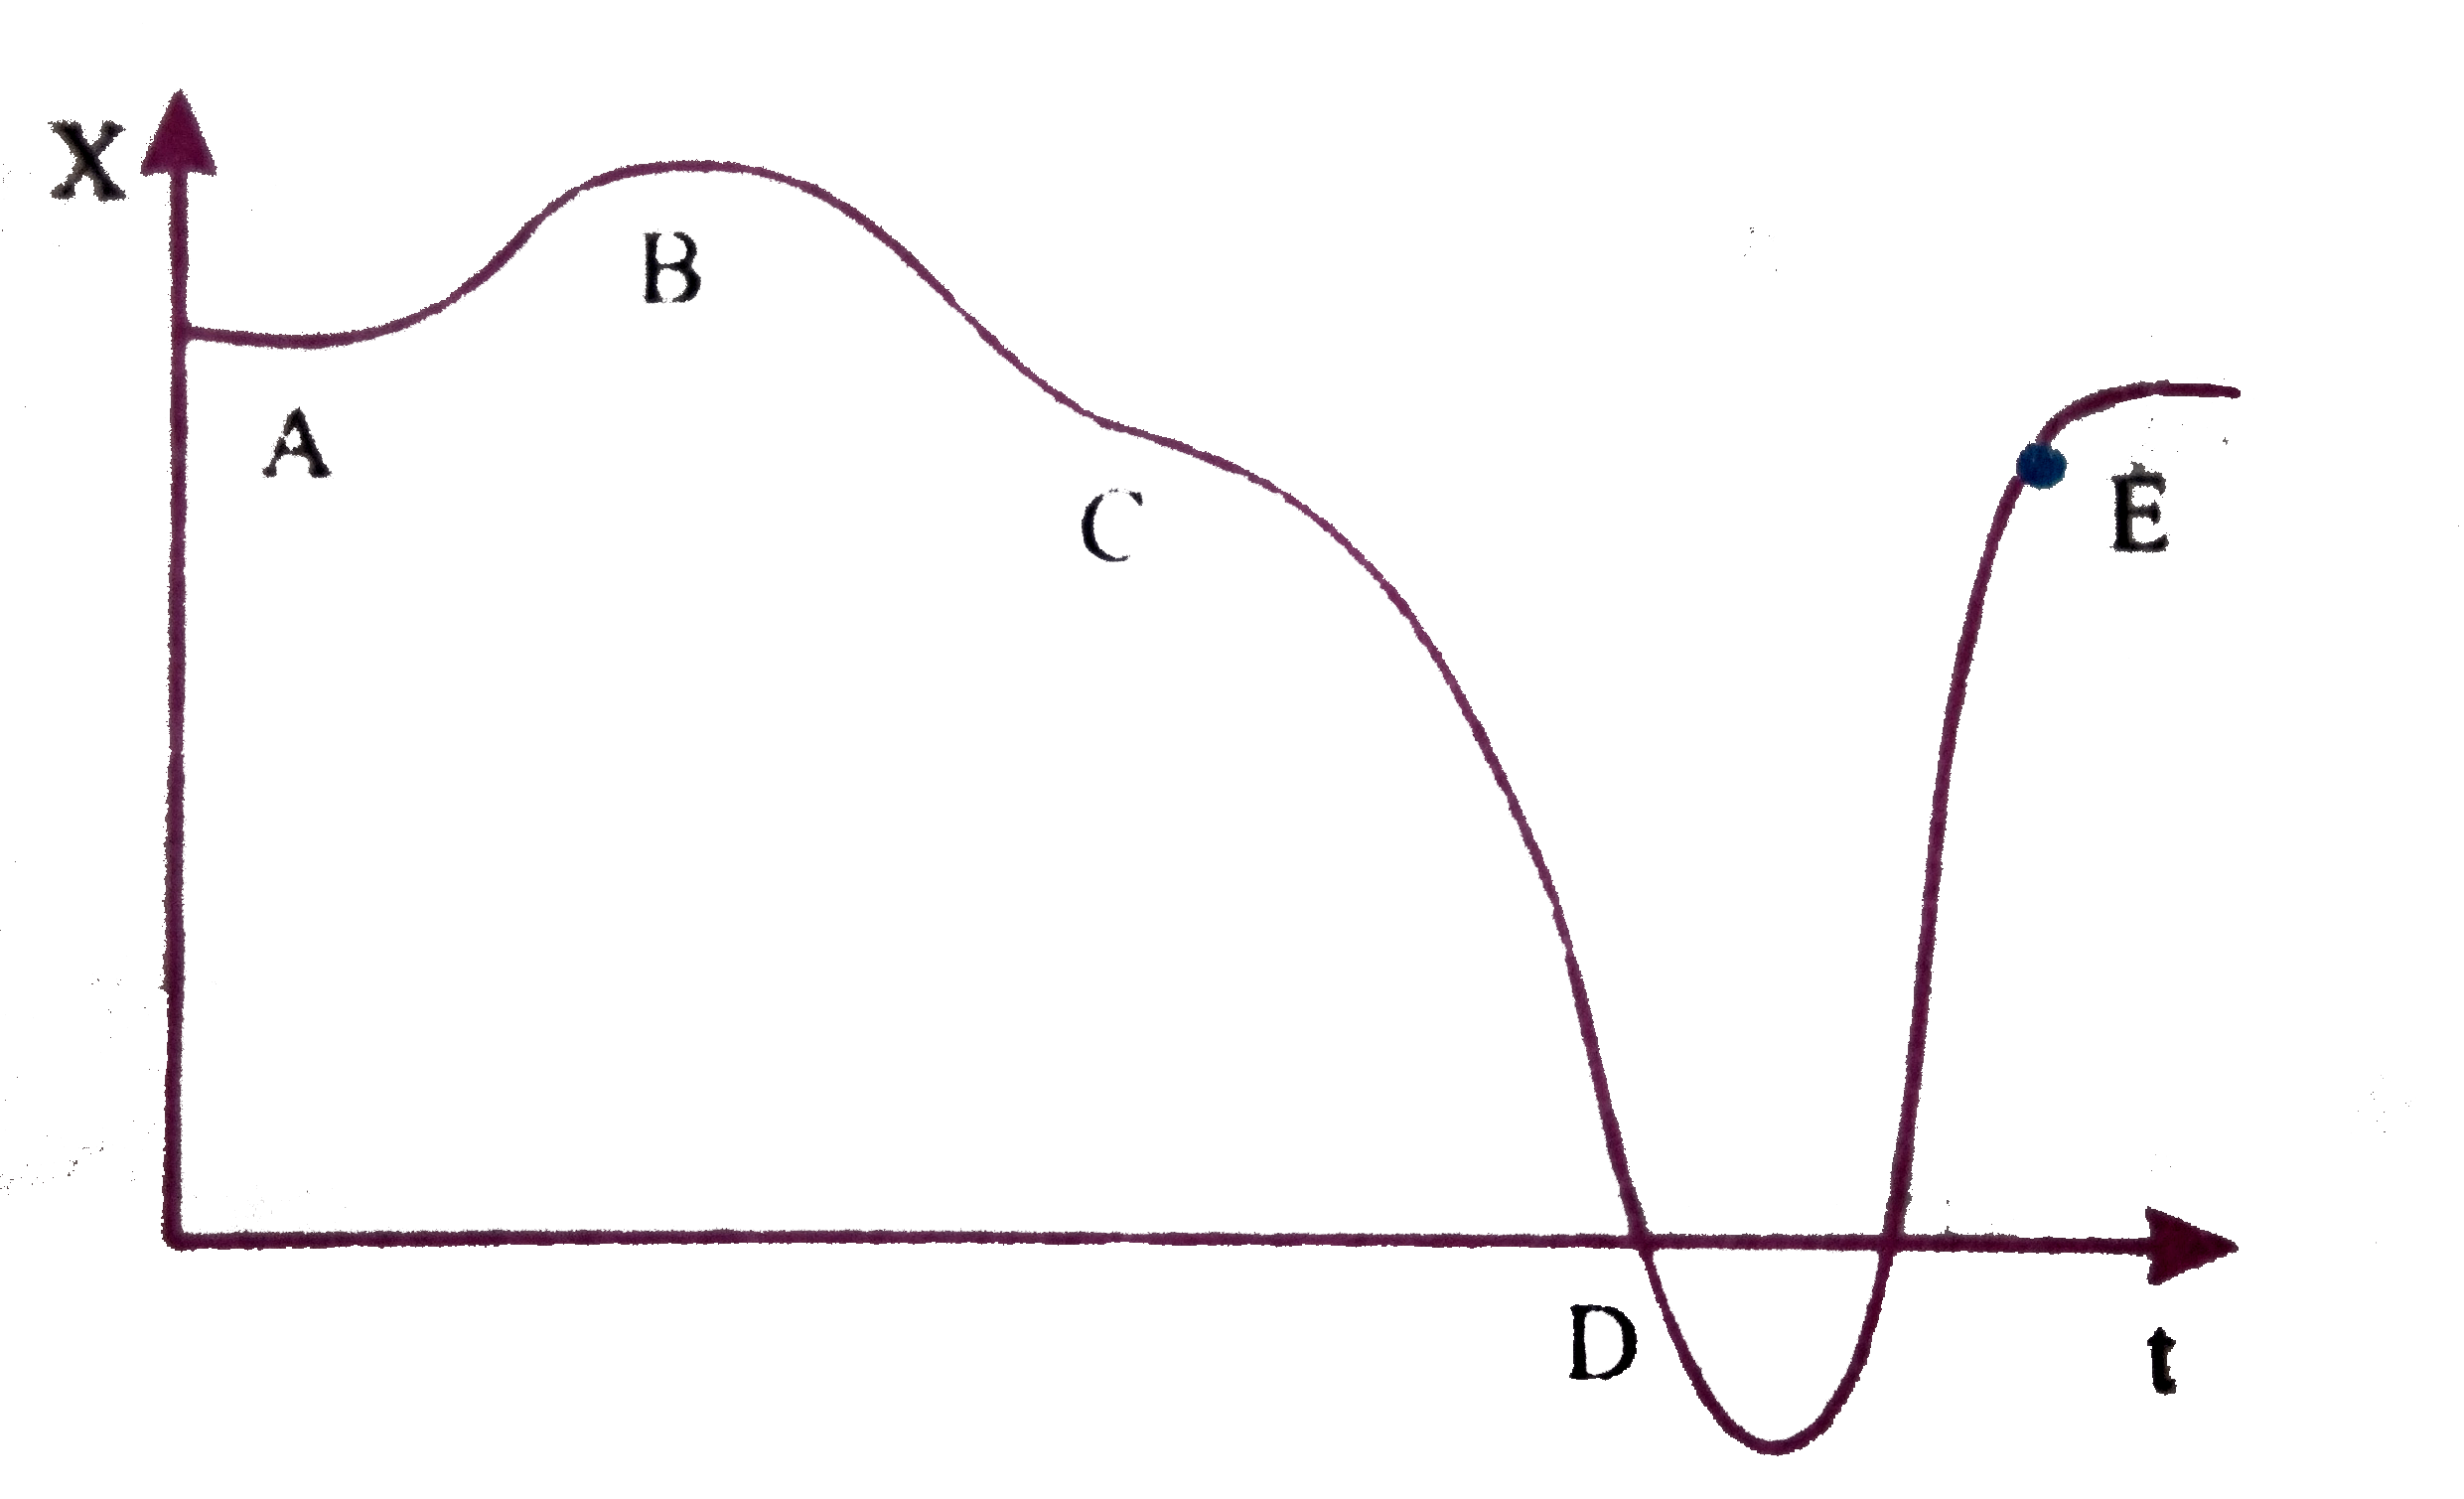
- A graph of x versus t is shown in figure. Choose correct alternative f...
Text Solution
|
- For the one dimensional motion, described by x=t-sint
Text Solution
|
- A spring with one end attached to a mass and the other to a right supp...
Text Solution
|
- A ball is bouncing elastically with a speed 1 m/s between walls of a r...
Text Solution
|
- A particle is thrown in vertically in upward direction and passes thre...
Text Solution
|