A
B
C
D
Text Solution
AI Generated Solution
The correct Answer is:


Topper's Solved these Questions
Similar Questions
Explore conceptually related problems
NCERT FINGERTIPS-BIOMOLECULES-Biomolecules
- Select the right option regarding the given graph.
Text Solution
|
- Which one of the given graphs shows the effect of pH on the velocity o...
Text Solution
|
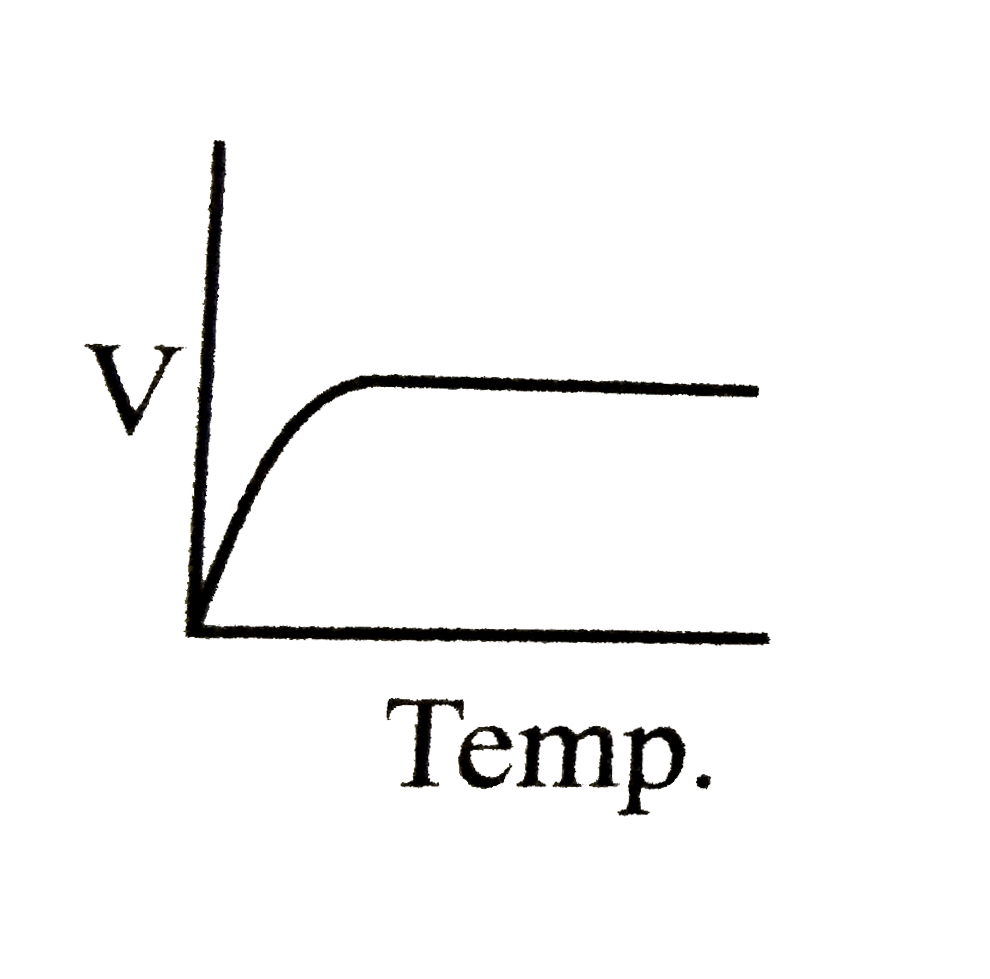
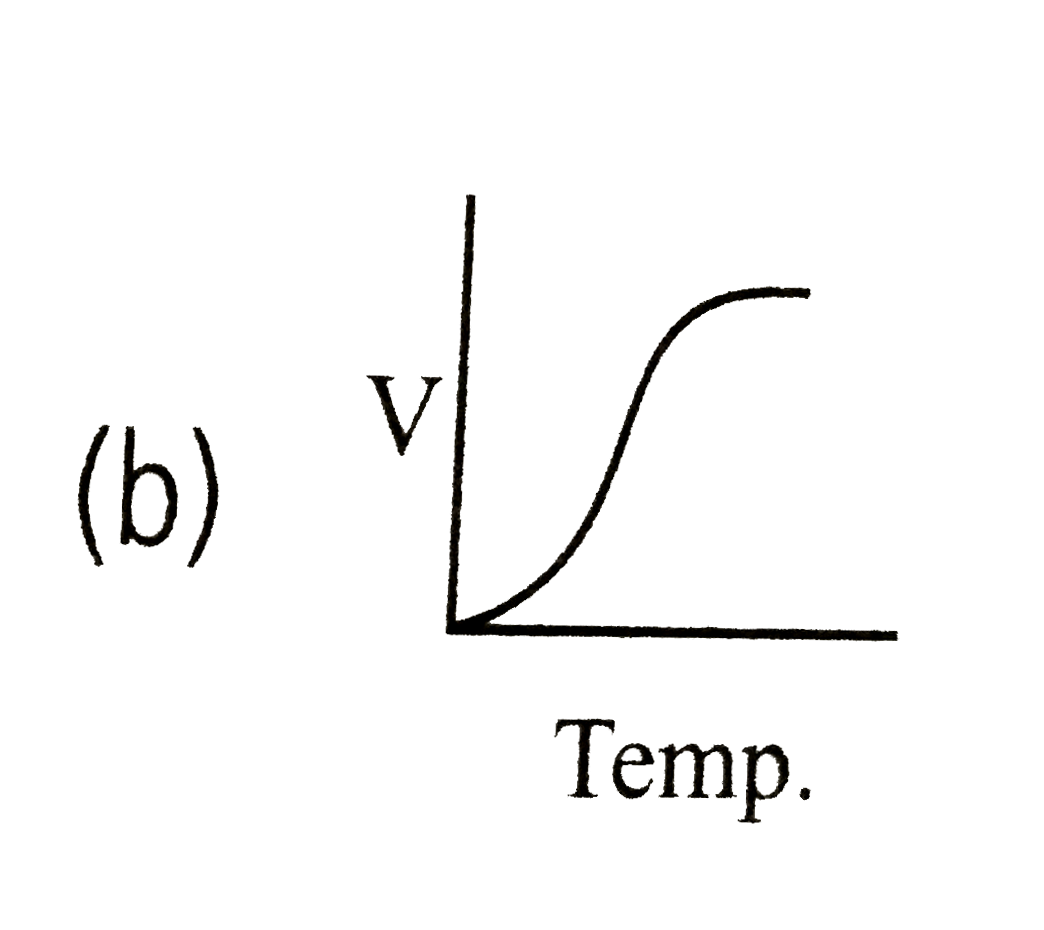
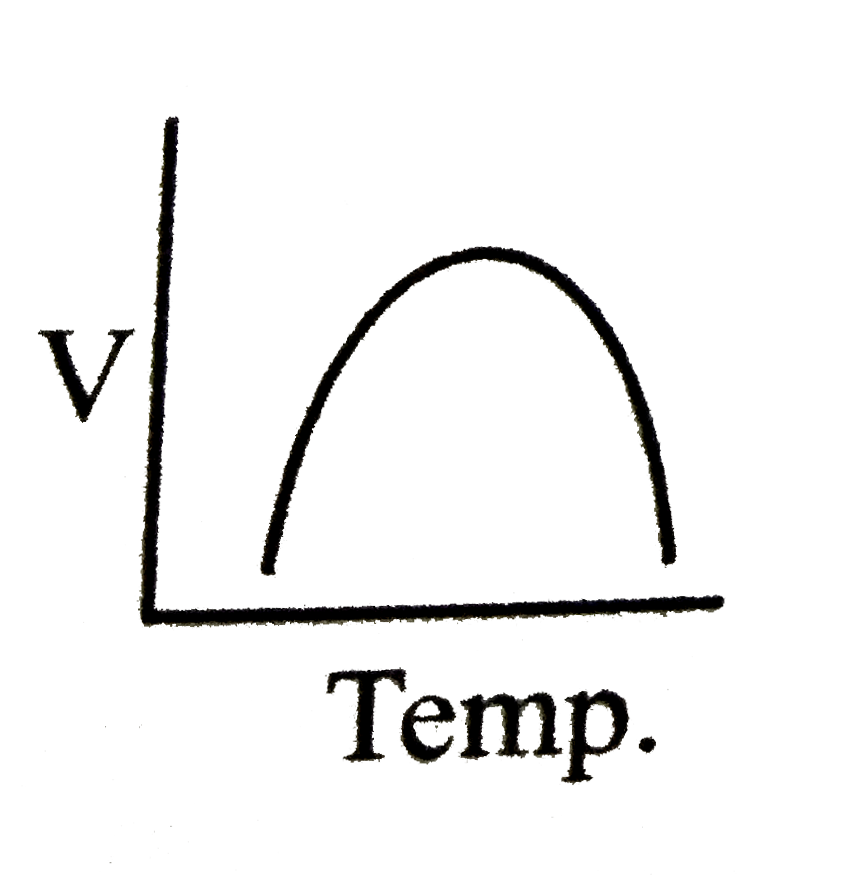
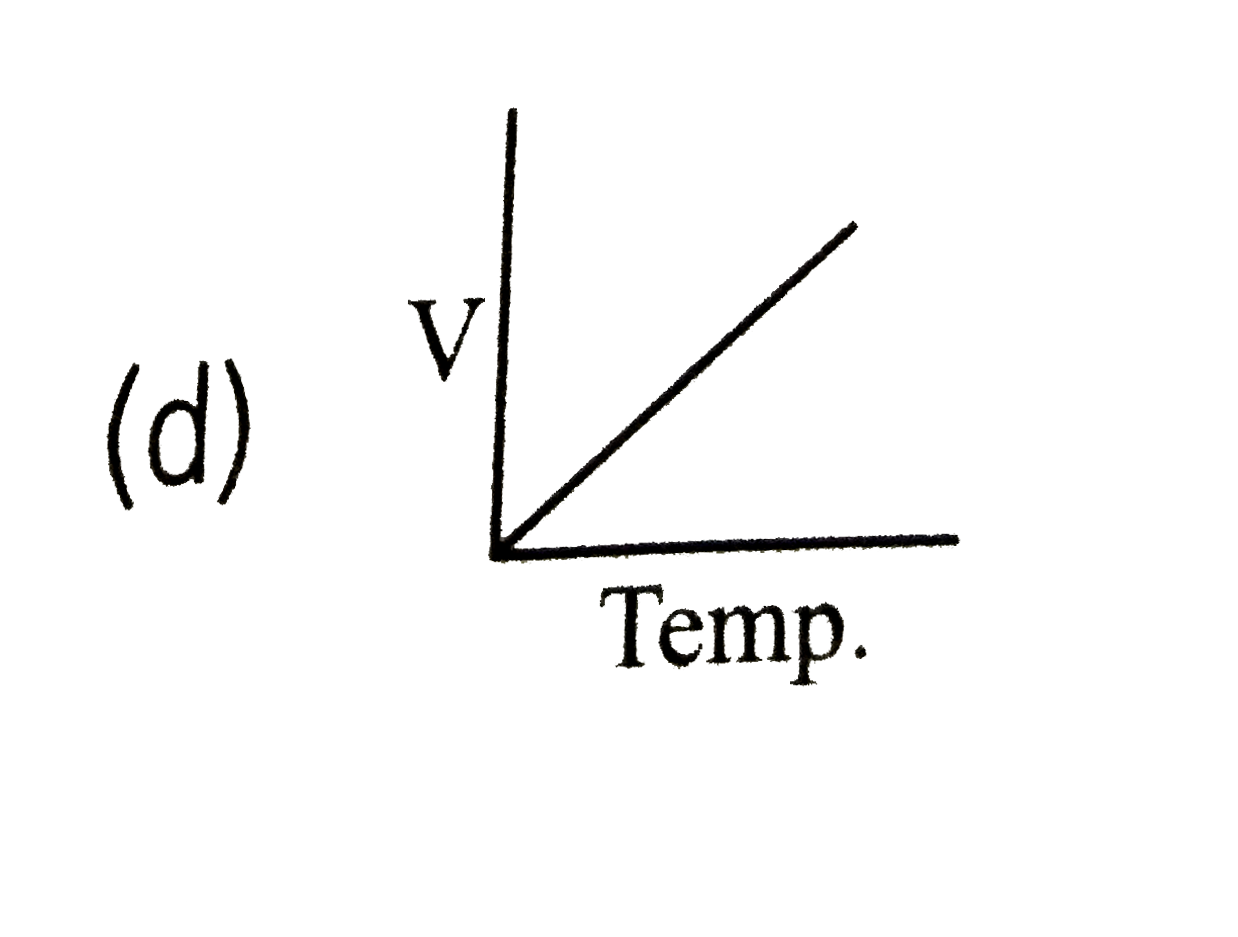
- Which one of the given graphs shows the effect of temperature on the v...
Text Solution
|
- Enzymes are most functional within the temperature range of
Text Solution
|
- Which of the following graphs shows the relationship between the rate ...
Text Solution
|
- Michaelis Menten Constant (K(m)) is equal to
Text Solution
|
- The inhibitor which closely resembles the substrate in its molecular s...
Text Solution
|
- inhibition of succinate dehydrogenase by malonate is an example of
Text Solution
|
- The inhibitor which does not resemble the substrate in structure and b...
Text Solution
|
- Feedback inhibition of an enzyme is influenced by
Text Solution
|
- Refer to the given reactin. {:(C(12)H(22)O(11)+H(2)O overset(Enzyme ...
Text Solution
|
- Enzymes that catalyse removal of groups from substrates by mechanisms ...
Text Solution
|
- Dihydroxyacetone-3 phosphate and glyceraldehyde-3-phosphate are interc...
Text Solution
|
- Which of the following is an example of isozyme ?
Text Solution
|
- Holoenzyme is the complete enzyme consisting of an apoenzyme and a co-...
Text Solution
|
- The proteinaceous molecule that joins a non-protein prosthetic group t...
Text Solution
|
- Read the given paragraph with few blanks. Prosthetic groups are unde...
Text Solution
|
- Co-enzyme nicotinamide adenine dinucleotide (NAD) contains vitamin
Text Solution
|
- Zinc is a co-factor for proteolytic enzyme .
Text Solution
|
- Select the incorrect statement from the following.
Text Solution
|